Figure 2.
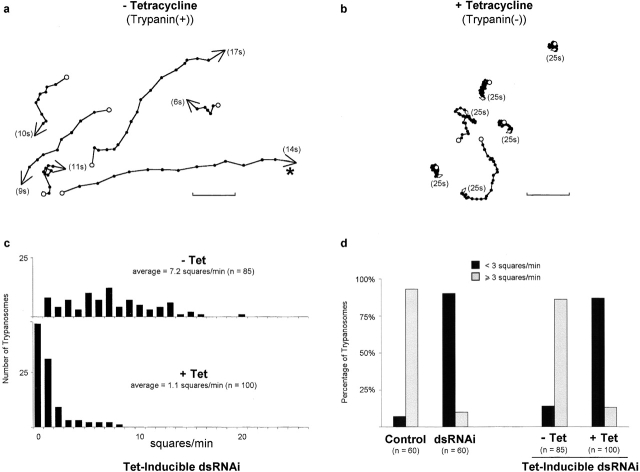
Quantitative analysis of cell motility. (a and b) Motility traces of trypanin(+) (a) and trypanin(−) (b) cells. The positions of individual cells are plotted at one second intervals (•). The starting position of each cell is marked with an open circle and the ending position is marked with an arrowhead. The number in parentheses indicates the time in seconds that a given cell was within the field of view. Bar, 50 μm. The average velocity of a wild-type/trypanin(+) cell moving primarily in one direction (a, *) is 20 μm/s, consistent with previous reports (Bastin et al., 1999). Video clips used to generate these motility traces (Videos 1, trypanin[+] and 2, trypanin[−]) are available at http://www.jcb.org/cgi/content/full/jcb.200201036/DC1. (c) Histograms show the range of motility of 85 trypanin(+) cells (− Tet) and 100 trypanin (−) mutants (+ Tet) in a quantitative motility assay that measures the number of squares (50 μm × 50 μm) each cell traverses per unit time. (d) Histogram shows the percentage of cells that migrate <3 squares/minute (black bars) or ≥ 3 squares/min (gray bars) in this assay. Assays were performed with cells constitutively expressing a control DNA construct (d, Control), or trypanin-dsRNA (d, dsRNAi), or with KHTb12 cells (a–c and d, Tet-Inducible dsRNAi) grown with (+) or without (−) 1 μg tetracycline/ml as indicated.

