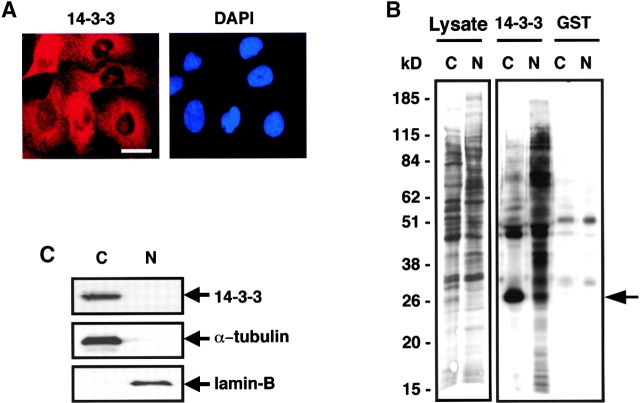
Figure 1.
Different subcellular distributions of 14-3-3 and its ligands. (A) U2OS cells immunostained for 14-3-3σ (left) and corresponding DAPI staining (right). Bar, 10 μm. (B) Biochemical fractionation of U2OS cells followed by immunoblotting using an antibody recognizing all 14-3-3 isotypes (N, nuclear fraction; C, cytoplasmic fraction). Blots were probed with anti–α-tubulin (cytoplasmic) or anti–lamin B (nuclear) as controls. A very small amount of 14-3-3 is present in the nuclear fraction but cannot be seen in this exposure. (C) U2OS cells were metabolically labeled with [35S]methionine, fractionated, and nuclear (N) and cytoplasmic (C) fractions containing equal amounts of protein and radioactivity were incubated with beads containing GST–14-3-3 or GST alone. Bound proteins were visualized by SDS-PAGE and autoradiography. A small portion of the input sample is shown on the left (Lysate lanes). Positions of molecular weight markers, in kD, are indicated. The prominent band at ∼28 kD in the cytoplasmic/14-3-3–GST lane (arrow) is endogenous U2OS 14-3-3 (Rittinger et al., 1999).

