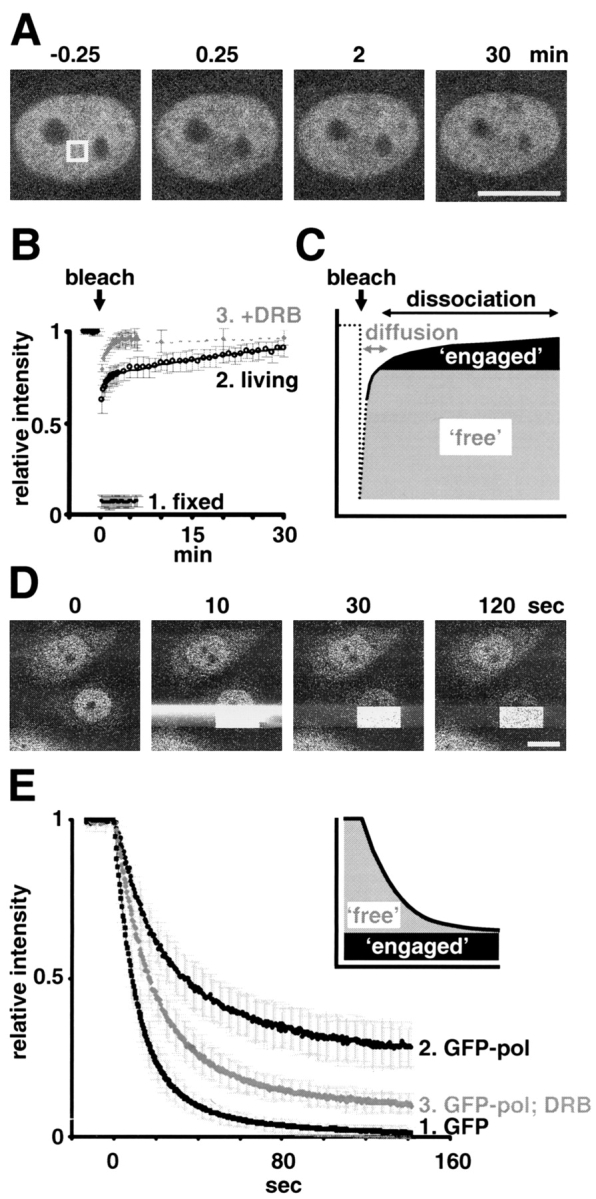
Figure 1.

GFP-pol kinetics. (A) FRAP example. Images of typical equatorial sections before and after bleaching the square area. Bar, 10 μm. (B) FRAP results for fixed (4% PFA), living, and DRB-treated (100 μM for 0.5–2 h) cells (± SD, n ≥ 18). The curve for living cells fits the equation: relative intensity = 0.7464 + 0.2482· [1−exp(0.000568·t)] from 90 s. (C) FRAP interpretation. One kinetic population enters the bleached zone quickly (e.g., through diffusion), whereas the other can only initiate once engaged and bleached polymerases have terminated and dissociated. (D) FLIP example. Half the lower nucleus was bleached progressively as confocal images were collected approximately every 0.43 s. The intense signal to the left and right of the bleached rectangle is an artifact. Bar, 10 μm. (E) FLIP results (± SD, n ≥ 15). Inset; kinetics of curve 2 are consistent with there being two populations, one that rapidly enters the bleaching zone, the other being engaged and so remains unbleached.
