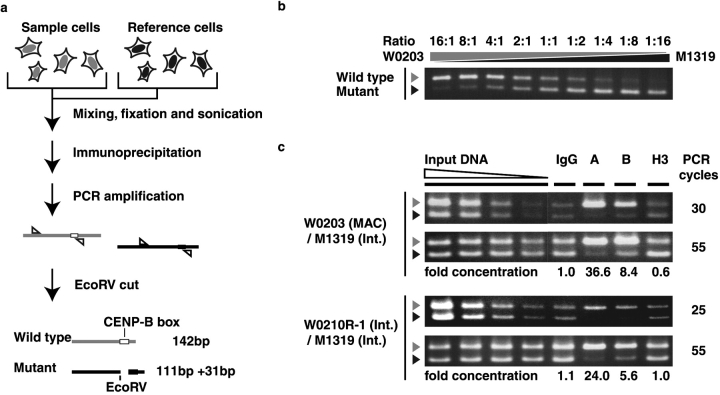
Figure 5.
CHIP analysis of centromere protein assembly on introduced alphoid DNA. (a) pWTR11.32-transformed cells (W0203 or W0210R-1) were mixed with reference pMTR11.32-transformed cells (M1319). (b) EcoRV-digested PCR products from genomic DNA templates. W0203 and M1319 cells were mixed at different ratios of cell number (from 16:1 to 1:16), and genomic DNAs for competitive PCR were prepared from these mixtures. Gray arrowheads indicate the 142-bp PCR fragment from WTR. Black arrowheads indicate the 111-bp PCR fragment from MTR. (c) EcoRV- digested PCR products from immunoprecipitated DNA template. Left four lanes show PCR products from diluted input DNA at 10−1, 10−2, 10−3, and 10−4 dilution, from left to right. PCR products from immunoprecipitated DNAs are shown in the right four lanes. Capital letters indicate antibodies used in immunoprecipitation: normal mouse IgG (IgG), anti–CENP-A (A), anti–CENP-B (B), and anti–histone H3 (H3). Two different rates of amplification, logarithmic amplification state (25–30 cycles) and plateau state (55 cycles), are shown in the top and bottom panels, respectively. DNA samples comprised 75% and 15% of total PCR products in the top and bottom panels, respectively. Relative concentrations of the WTR DNA fragment versus the MTR DNA fragment, as indicated by CHIP assay using each antibody, are shown below the panels.

