
Figure 6.
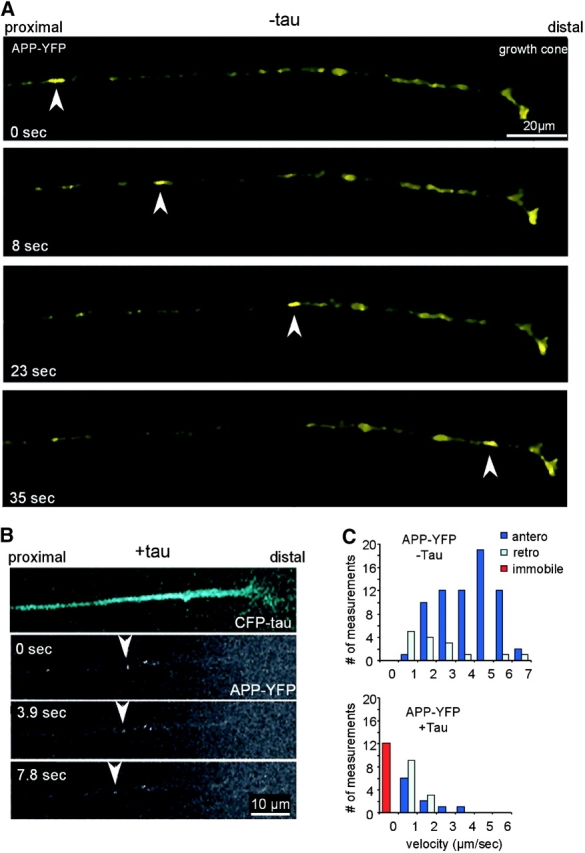
Time-lapse imaging of APP-YFP transport in cultured chick retinal ganglion neurons and inhibition by tau. (A) After 1 d in culture, the RGCs were transfected with APP-YFP AV and analyzed 48 h later (transfection rate 80%). Image frames were collected every 3.9 s. The arrowheads point at an elongated vesicle carrying APP-YFP moving rapidly toward the growth cone on the right (average velocity, 4.5 μm/s; instantaneous velocity, up to 7 μm/s). The particle resides in the growth cone and eventually disappears. (B) Double transfection of RGCs with CFP-htau40 and APP-YFP (30% double transfection). The top shows the blue fluorescence of tau throughout the axon and growth cone, and the bottom shows yellow fluorescent APP vesicles. Very few particles are visible in the presence of tau, and they slowly move in the retrograde direction (0.4 μm/s; arrowheads). (C) Quantification: fractions of particles moving in RGCs transfected with APP only or with APP and tau. Particle movement was classified by direction (anterograde and retrograde) and speed (bins of 1 μm/s). Anterograde vesicles predominate, and speeds can be up to 7 μm/s (clustered particles forming immobile traffic jams were not scored here). After transfection with tau, very few vesicles move, many are immobile (red bar), and slow speeds predominate in both directions.