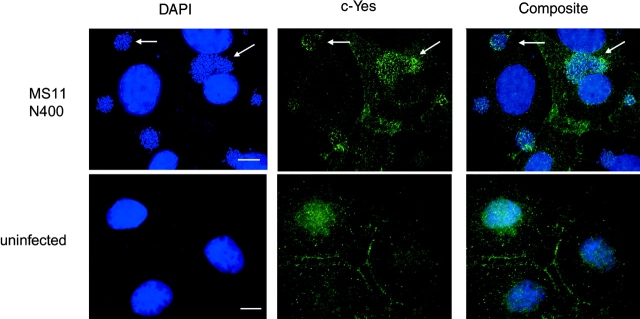
Figure 2.
c-Yes clustering beneath GC microcolonies in infected epithelial cells. A431 endocervical epithelial cells were infected with MS11 N400 for 3 h (top) or left uninfected (bottom), and then fixed and processed for immunofluorescence deconvolution microscopy using anti–c-Yes antibodies to visualize the kinase (middle) and DAPI to visualize nuclei and GC microcolonies (left). The clustering of c-Yes beneath the microcolonies can be seen in the composite image (right). Arrows denote the location of some microcolonies. Images are 0.2-μm-thick optical sections of the apical surfaces of cells obtained using a Deltavision restoration microscope (API) with a 60× oil objective.

