
Figure 1.

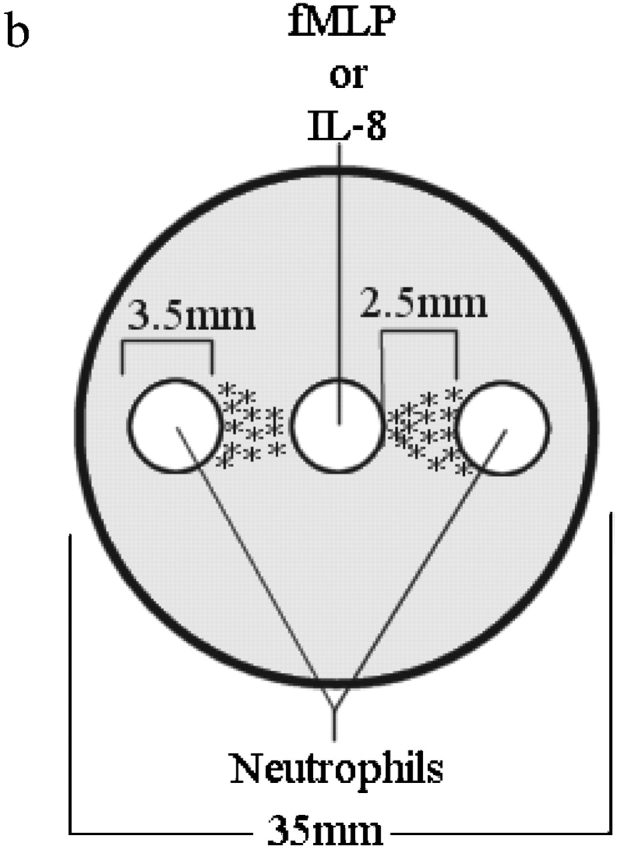

Gel setup and analysis. (a) Target areas used to measure chemotaxis. Randomly migrating neutrophils will appear in equal numbers in both target areas. Directionally migrating neutrophils will only be found in target area A. The number of chemotaxis cells can be determined by subtracting the number of cells in area B from the number of cells in area A. (b) Under agarose setup used for dose response experiments. (c) fMLP dose response. Data is shown as mean ± SEM (n = 8). *P < 0.05 compared with 0.0 pmol fMLP.