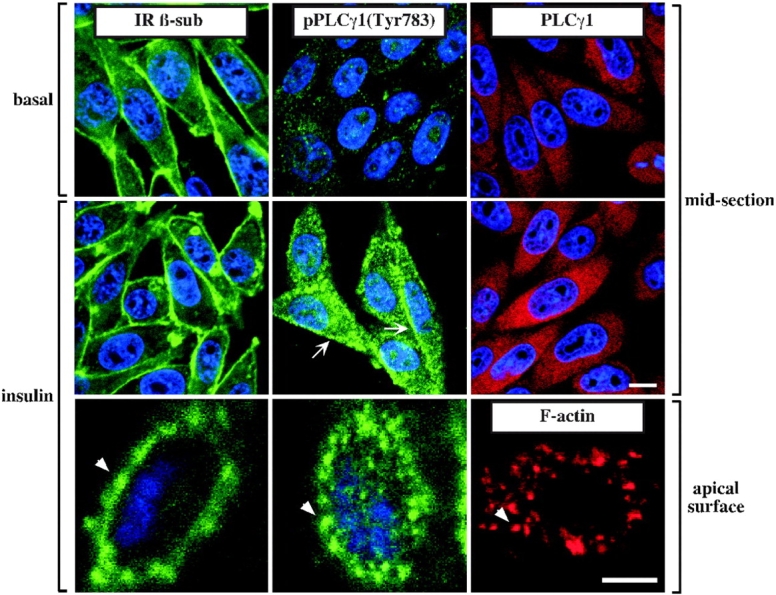
Figure 5.

Cellular localization of IR and tyrosine-phosphorylated PLCγ1. CHO-IR cells were left untreated or were stimulated with 100 nM insulin for 10 min before fixation and permeabilization. Cells were stained with antibodies against IR β-subunit (left panels), pPLCγ1 (middle panels), and total PLCγ1 (top two right panels). Bound primary antibodies were detected with Alexa® 488–conjugated (green) or Alexa® 568–conjugated (red) secondary antibody, and DNA was stained blue by TO-PRO®-3. In some instances, cells were stained only for F-actin using Alexa® 568–conjugated phalloidin (red). Confocal sectioning in mid area (bar, 10 μm) and apical surface (bar, 5 μm) of representative cells is shown. Similar results were obtained in at least three independent experiments. Arrows indicate localization of tyrosine-phosphorylated PLCγ1 to the plasma membrane. Arrowheads indicate punctate signal coalescence at the plasma membrane.
