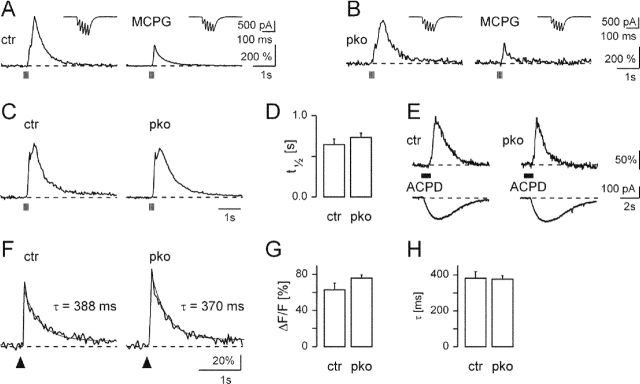
Figure 4.
Synaptic calcium signaling is normal in PC dendrites of cGKIpko mice. Complex synaptic Ca2+ signals were recorded from active dendritic microdomains in response to repetitive synaptic stimulation of parallel fibers (five pulses, 50 Hz, delivered at the time indicated by vertical bars) of control mice (ctr) and cGKIpko mice (pko). (A and B) Representative recordings under standard conditions (left) and in the presence of 2 mM MCPG ([R,S]-α-methyl-4-carboxyphenylglycine) (right), which blocks the delayed mGluR1-mediated Ca2+ signal component. The insets show the corresponding EPSCs. (C) Average of complex synaptic Ca2+ signals obtained from all synaptic inputs tested (19 inputs in control mice, 28 inputs in cGKIpko mice). Ca2+ signals are normalized to the peak of the early, MCPG-insensitive component. (D) Summary plot of the average duration of synaptic Ca2+ signals (time at which the Ca2+ level reached half amplitude of the early component, t1/2) in control (n = 19 synaptic inputs) and mutant mice (n = 28 synaptic inputs). (E) Ca2+ signals (top) and corresponding inward currents (bottom) in response to local application of the mGluR agonist t-ACPD (bar). Signals were evoked by pressure ejection of t-ACPD (200 μM, 1 s) from an application pipette placed ∼15 μm above the dendrites of a voltage-clamped PC. (F) Ca2+ transients evoked by climbing fiber activation (marked by arrowheads) in a representative control (ctr) and a cGKIpko (pko) mouse. The respective decay time constants (τ) are indicated. (G) Summary plot of the average amplitude of climbing fiber–evoked Ca2+ transients. (H) Summary plot of the average decay time constant of climbing fiber–evoked Ca2+ transient. Bar graphs in G and H contain data from 14 responses obtained in three cells for control and 25 responses obtained in six cells from cGKIpko mice. Neither in G nor in H was a significant difference between both experimental groups observed.

