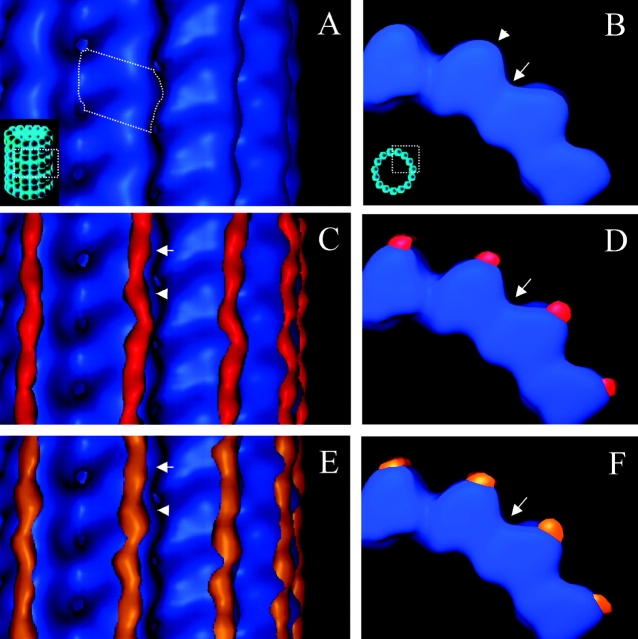
Figure 3.
MAP2c and tau form ordered densities protofilament ridges. (A) En face view of the undecorated microtubule map showing four protofilaments. A tubulin monomer is outlined by a dotted line. (B) View of the undecorated microtubule map from the minus end showing the smooth curvature of protofilament ridges (arrowhead) separated by valleys between protofilaments (arrow). (C and E) En face views of MAP2c (red) and tau (orange) difference maps displayed with the microtubule map (blue). Arrows and arrowheads indicate two different density peaks in the elongated difference map associated with each 40-Å longitudinal repeat of tubulin. (D and F) Views of C and E from the microtubule minus end showing the slender profile of MAP2c and tau densities compared with tubulin. No difference densities are seen in the valleys between protofilaments (arrows).

