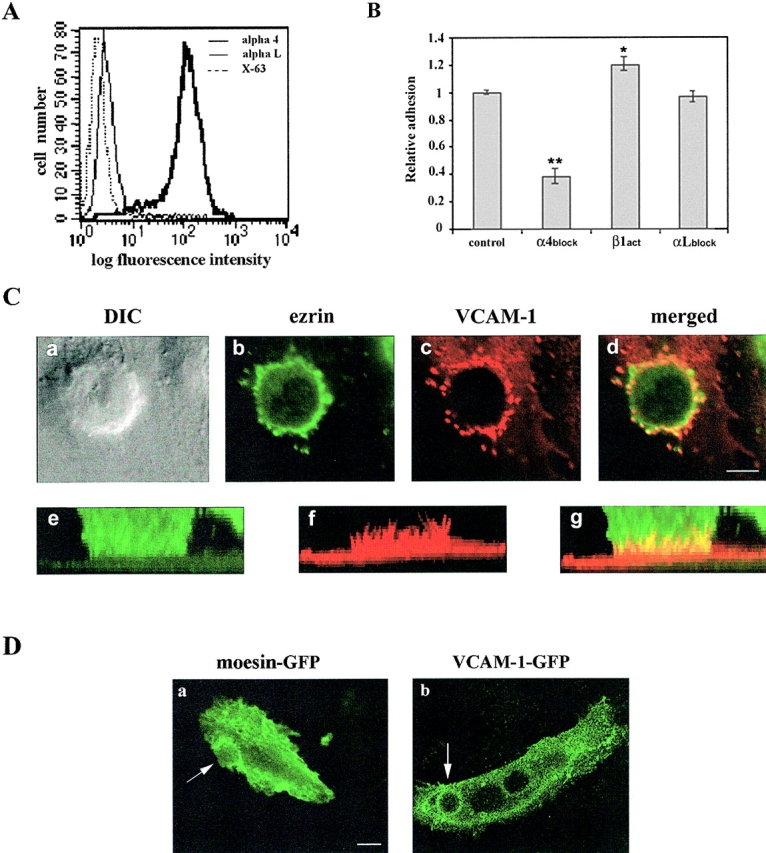
Figure 5.

Localization of VCAM-1 and ezrin at the contact area of activated HUVEC with leukocytes. (A) Expression of α4-integrin (thick line), and αL-integrin (thin line) on 4M7 cells as determined by flow cytometry analysis. P3×63 (dotted line) was used as negative control. (B) Adhesion to activated HUVEC of 4M7 cells pretreated with the blocking anti-α4 mAb HP2/1, the activating anti-b1 mAb TS2/16, or the blocking anti-αL mAb TS1/11. Values correspond to the arithmetic mean ± SD of a representative experiment run by triplicate out of three independent ones. Statistically significant values, as defined by unpaired Student's t test, are indicated with * (P < 0.005) or ** (P < 0.0001), compared with no mAb treatment. (C) 4M7 cells interacting with activated endothelial cells were fixed, permeabilized, and stained with the anti-ezrin pAb 90/3 (green) and the anti–VCAM-1 mAb P8B1 (red). Representative horizontal sections of confocal laser scanning images (b and c) are merged in d. The corresponding DIC image is shown in a. The corresponding three-dimensional reconstruction is presented in e–g. Bar, 5 μm. (D) 4M7 cells were allowed to adhere to activated HUVEC transfected with moesin- or VCAM-1–GFP. GFP staining was monitored using live time-lapse fluorescence confocal microscopy. Horizontal sections showing the staining of moesin- (a) or VCAM-1–GFP (b) after 60 min of leukocyte–endothelium interaction. Arrows point to the GFP proteins clustered in the anchoring structure. Bar, 20 μm.
