
Figure 1.
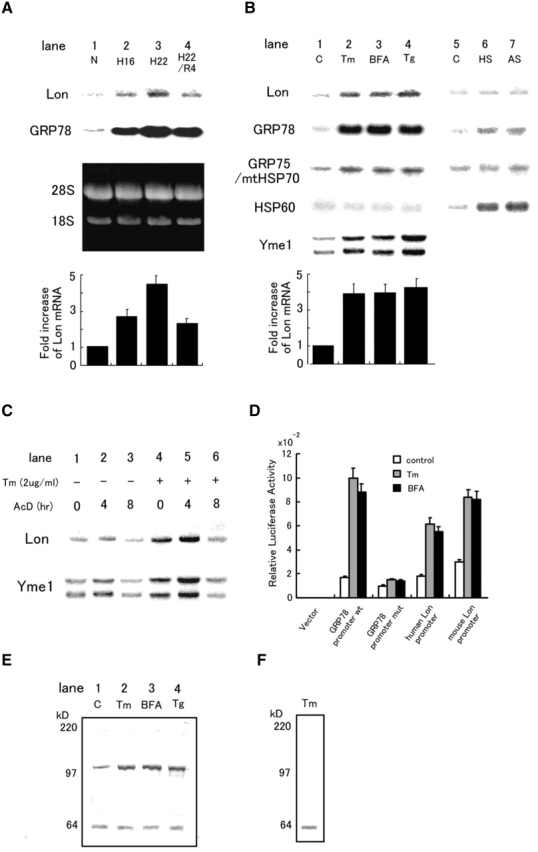
Expression of Lon in response to cell stress. (A) Expression of Lon and GRP78 mRNA in cultured astrocytes subjected to various stresses for the indicated periods: N, normoxia for 22 h; H16 and H22, hypoxia for 16 and 22 h, respectively; R, hypoxia for 22 h followed by reoxygenation for 4 h. The third (dark) panel shows the ethidium bromide stained gel. Quantification of relative intensities for Lon mRNA was accomplished by laser densitometry, and is shown as fold increase (normoxic controls were arbitrarily assigned a value of 1). The values shown are means ± SD of three experiments. (B) Expression of Lon, GRP78, GRP75/mtHSP70, HSP60, and Yme1 mRNA in HeLa cells subjected to other forms of stress. Tm (2 μg/ml for 16 h); BFA (5 μg/ml for 16 h); Tg (no treatment). (C) Effects of actinomycin D on the expression of Lon and Yme1. HeLa cells were exposed to actinomycin D (AcD; 5 μg/ml) for the indicated times in the presence/absence of tunicamycin (cells were pretreated with the latter for 16 h) and Northern blotting was performed. (D) Relative luciferase activity of Lon promoter–luciferase constructs. Human or mouse Lon promoter, wild-type or mutant GRP78 promoter in the pGL3 basic vector, or pGL3basic vector alone was transfected with pRL-SV40 into HeLa cells. Relative luciferase activity was measured as described in the text. (E) Expression of Lon protein in response to ER stress. HeLa cells were treated with Tm, BFA, or Tg as described above, and Western blotting was performed with anti-Lon antibody 665. Migration of simultaneously run molecular weight standards is indicated on the far left in kD. (F) Competition of Lon antigen with a 100-fold excess of the synthetic Lon peptide was examined using cell extracts from HeLa cells treated with Tm as described above.