
Figure 8.
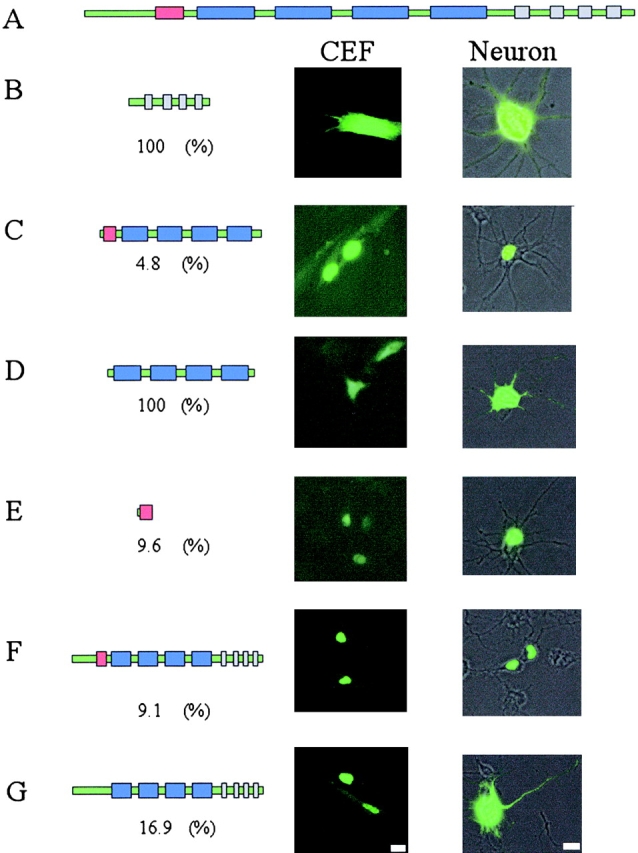
Nuclear versus cytoplasmic distribution of ZBP2 in fibroblasts and neurons. The gene structure of ZBP2 is demonstrated in A. Red bar, 47-aa insert; blue bars, KH domains; gray bars, COOH-terminal repeat of AWEEYYK motif. The various constructs of ZBP2; the full-length with or without the 47-aa insert (F and G), the 47-aa insert (E), the four KH domains (D), the central domain containing the four KH domains, and the 47-aa insert (C), or the COOH terminus of the protein (B) were fused to GFP and the cellular distribution characterized. The constructs are detailed in the left panels with cellular distributions in the right panels. The percent of cells with cytoplasmic signal was characterized for each construct in the number under each construct. Bars, 10 μm.