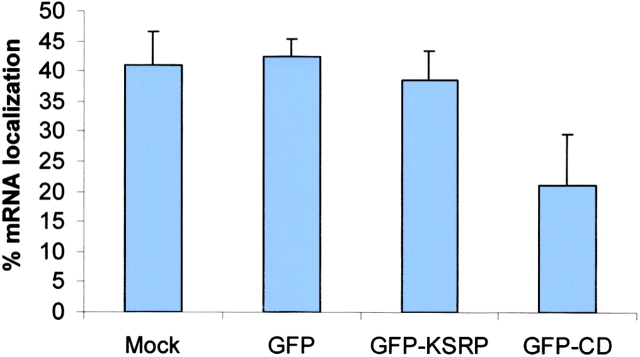
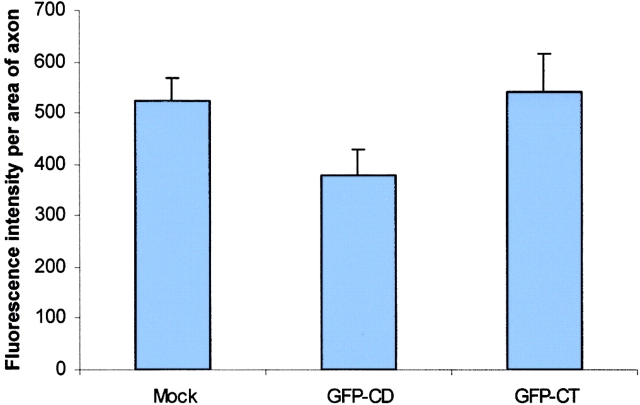
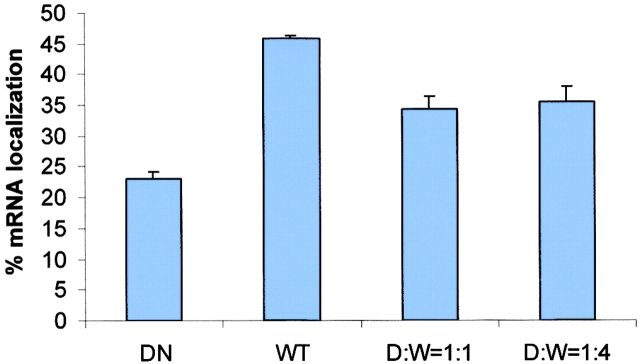
Figure 9.
A ZBP2 dominant negative construct suppresses β-actin mRNA localization. (Top) The percentage of transfected CEFs wth localized β-actin mRNA. CEFs were transfected for 6 h followed by fluorescence in situ hybridization. Transfected cells were scored for β-actin mRNA localization. GFP, vector pEGFPC1; GFP-CD, GFP fused with central domain; GFP-KSRP, GFP-human KSRP; Mock, no plasmid. The bars show percentage of transfected cells with localized β-actin mRNA in each experiment. At least 50 transfected cells were counted in each coverslip, two experiments each. (Middle) The β-actin mRNA signal in neuronal processes. Experiments were parallel to A except that the COOH terminus of ZBP2 (GFP-CT) was used (Fig. 8, construct B). β-actin mRNA signal was measured and then converted into fluorescence units. (Bottom) The percentage of cotransfected CEFs with localized β-actin mRNA. CEFs were transfected either with single construct (wild-type ZBP2 or the dominant negative central domain construct) or both constructs of different ratios (dominant negative vs. wild-type 1:1 or 1:4) for 6 h. After FISH, transfected cells were scored as in Fig. 9 A.


