
Figure 5.
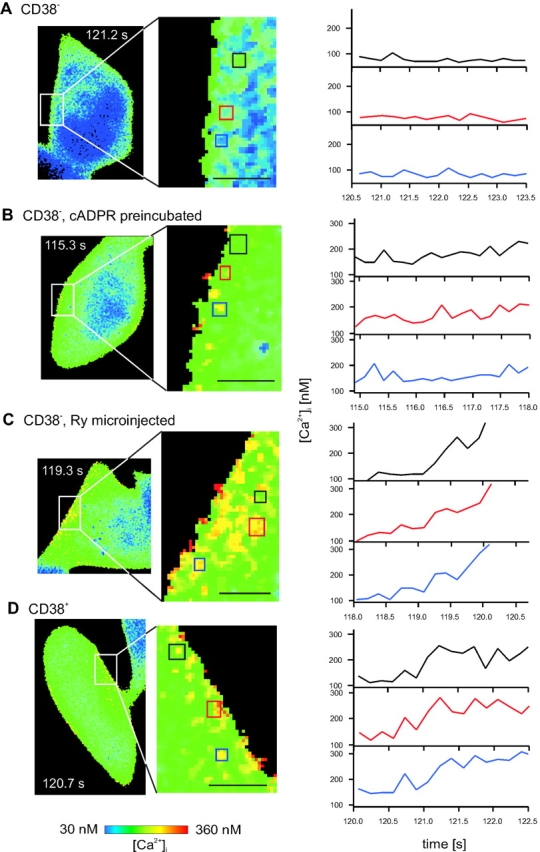
Analysis of subcellular Ca2 + signals in 3T3 fibroblasts. Confocal pseudocolor Ca2+ images of the early pacemaker phase upon ATP stimulation of a CD38− cell (A), a CD38− cell preincubated with 50 μM cADPR (B), a CD38− cell microinjected with ryanodine 15 min before addition of ATP (Ry; pipette concentration 100 μM, final intracellular concentration ∼1 μM) (C), and a CD38+ cell (D), and magnifications of subcellular regions are displayed (Bars, 2.5 μm). The cells were stimulated at time point 115 s by 100 μM ATP. Right panel, Ca2+ tracings of selected ROIs (as indicated and color coded in the middle panel) are displayed. Characteristic cells were selected from n = 18 CD38− cells (A), n = 19 CD38− cells preincubated with cADPR (B), n = 15 CD38− cells microinjected with ryanodine, and n = 20 CD38+ cells.