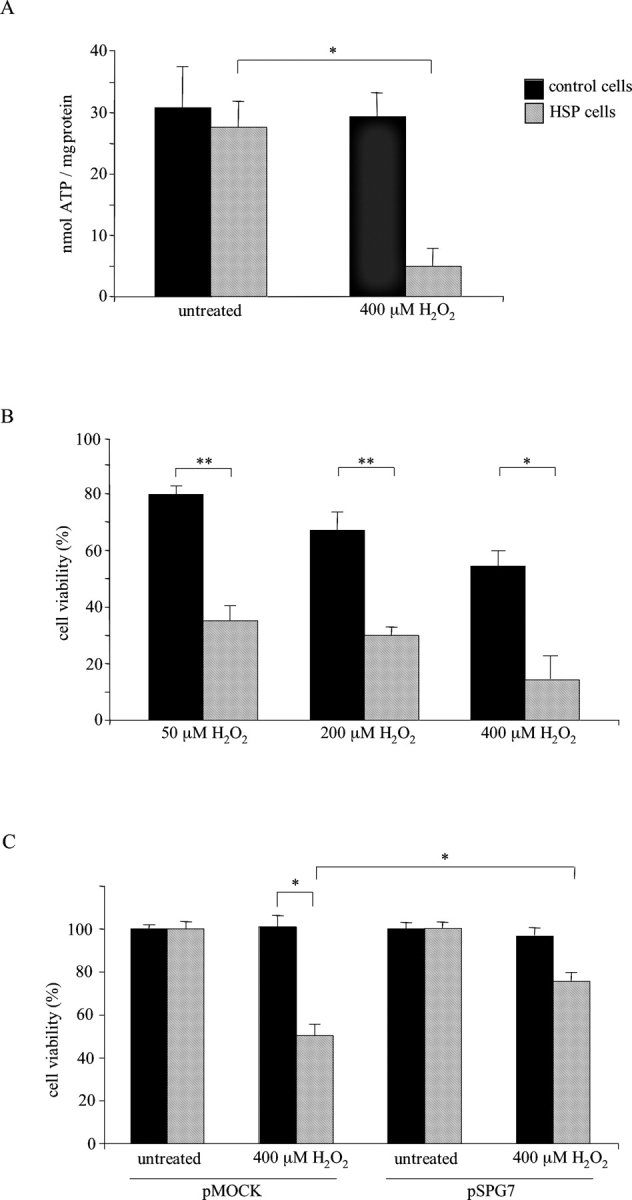
Figure 3.

Hydrogen peroxide challenge and phenotype rescue. (A) ATP depletion after oxidative stress. Data represent means of six independent experiments. (B) MTT reduction assay, data are expressed as percentage between the absorbance (570 nm) of treated and untreated cells; values, in triplicates, represent means of four independent experiments. (C) HSP and control cells transfections by paraplegin expressing vector pSPG7. Data, in triplicates, are indicated as mean of three independent experiments. *, P < 0.0005; **, P < 0.000001. Bars represent ±SEM.
