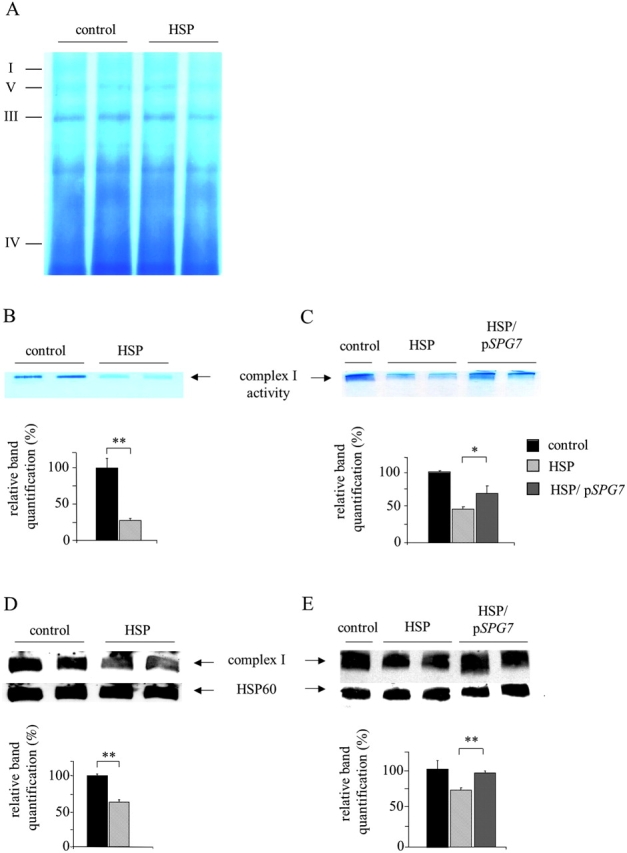
Figure 5.

Blue native gel electrophoresis of mitochondrial complexes. (A) Coomassie brilliant blue staining of mitoplast preparations. (B) Complex I in situ activity staining by nitro blue tetrazolium reduction assay. (C) Rescue of complex I in situ activity in HSP cells after pSPG7 transfection. (D and E) Western blot analysis of complex I revealed by anti–39-kD antibody. Immunoblotting with HSP60 antibody was used to verify equal loading. Activity and protein amount of complex I were quantified by densitometric analysis. *, P < 0.05; **, P < 0.001. Bars represent ±SEM.
