
Figure 1.
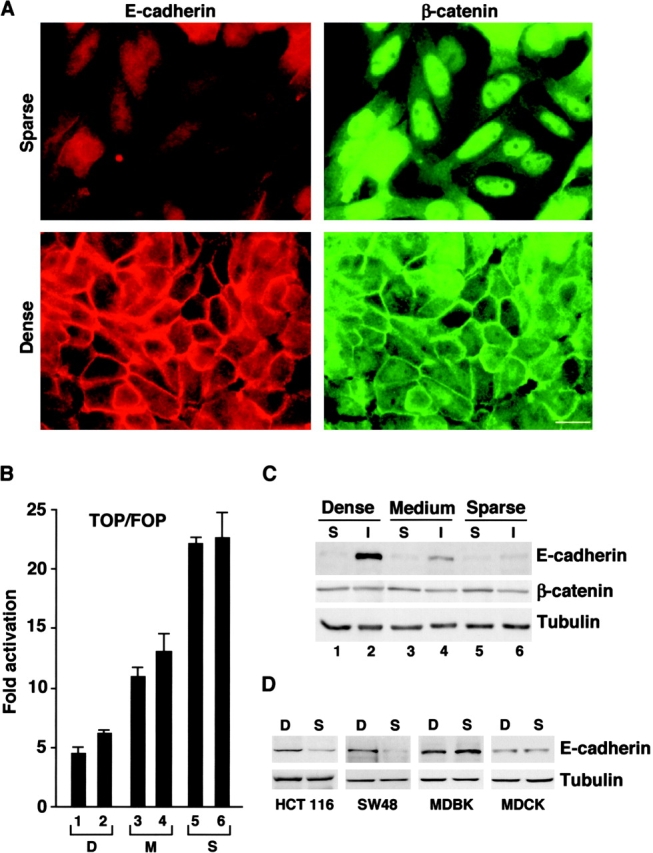
Regulation of E-cadherin expression and β-catenin localization and signaling by cell density. (A) SW480 cells were seeded from a semi-confluent culture dish at 6 × 10³ cells/cm2 (sparse) and 6 × 10⁴ cells/cm2 (dense), and after 2 d double stained for E-cadherin and β-catenin. (B) Cells cultured at different densities: lane 1, 6 × 10⁴ cells/cm2; lane 2, 3 × 10⁴ cells/cm2; lane 3, 2 × 10⁴ cells/cm2; lane 4, 1.5 × 10⁴ cells/cm2; lane 5, 104 cells/cm2; and lane 6, 8 × 10³ cells/cm2 were transiently transfected with TOPFLASH (TOP) or FOPFLASH (FOP) reporters and fold activation was determined in duplicate dishes. S, sparse; M, medium; D, dense. The error bars represent the mean ± SD from triplicate plates. (C) Cells grown at different densities were fractionated into Triton X-100–soluble (S) and –insoluble (I) fractions and equal volumes (from equal numbers of cells) were analyzed by Western blotting for E-cadherin, β-catenin, and tubulin levels. (D) HCT116, SW48, colon cancer cells, and MDCK and MDBK normal epithelial cells were grown as sparse (6 × 10³ cells/cm2) and dense (6 × 10⁴ cells/cm2) cultures, and the levels of E-cadherin and tubulin were determined. Note induction of E-cadherin expression, relocalization of β-catenin to the membrane and inhibition of β-catenin–mediated transactivation in dense SW480 cells. Bar, 10 μm.