
Figure 3.
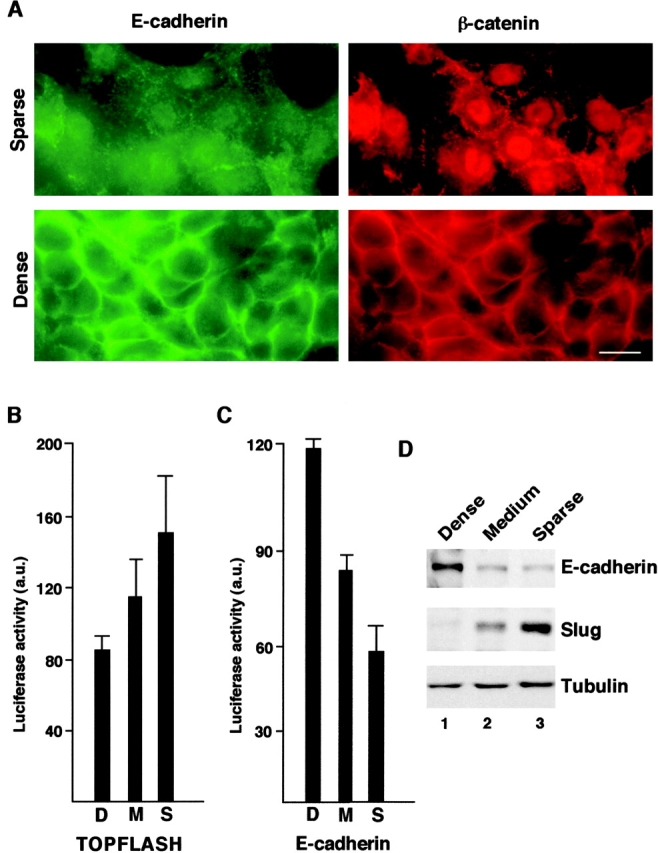
Regulation of E-cadherin, Slug, and β-catenin localization and signaling by cell density in HCT116 cells. (A) HCT116 cells were seeded as sparse and dense cultures (Fig. 1) and after 48 h the cells were double stained for E-cadherin and β-catenin. (B) Cells were seeded at different densities (as in Fig. 1A) and transfected with TOPFLASH, FOPFLASH, or (C) with the E-cadherin promoter reporter, and promoter activities were determined. (B and C) The error bars represent the mean ± SD from triplicate plates. (D) The levels of E-cadherin and Slug were determined by Western blot analysis 30 h after cell seeding at the densities indicated in Fig. 1 A. Bar, 10 μm.