
Figure 2.
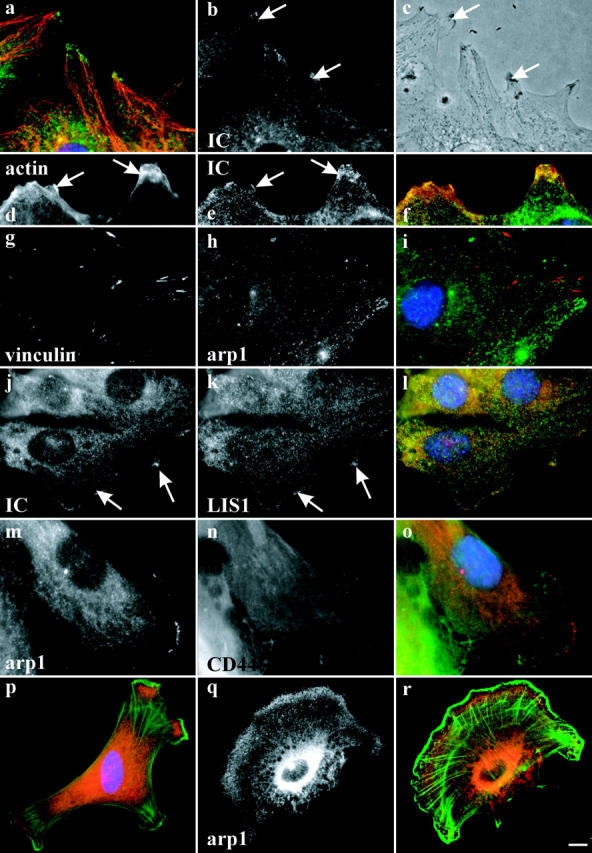
Relative distribution of dynein and dynactin to other cell markers. Immunofluorescence microscopy of wounded NIH3T3 cell monolayers (a–o) and chicken embryo fibroblasts (p–r). (a–c) Enrichment of dynein IC at the leading edge (arrows) of cells at regions of lamellipodial protrusion. (a) Immunofluorescence microscopy showing antitubulin (red) and antidynein IC (green); (b) antidynein IC alone; (c) phase contrast. (d–f) Distribution of dynein (e, green in f) versus actin (d, red in f). Dynein is enriched at these sites, but not coincident with actin (p–r). (g–i) Distribution of dynactin (h, green in i) versus vinculin (g, red in i). No clear evidence for colocalization is observed. (j and k) Distribution of dynein (j, green in l) versus LIS1 (k, red in l). Colocalization at sites throughout the leading edge is observed. (m–o) Distribution of dynactin (m, red in o) versus CD44 (n, green in o). The distributions of dynactin and CD44, which is enriched in membrane ruffles (not depicted), are distinct. (p–r) Relative distribution of dynactin (q, red in p and r) versus actin (green in p and r) in low density culture of chick embryo fibroblasts. Dynectin is diffusely enriched internal to actin. Cells in a–c were fixed 8 h, in d–l 1 h, and in m–o 6 h after wounding, respectively. Bar: (a–o) 5 μm; (p–r) 10 μm.