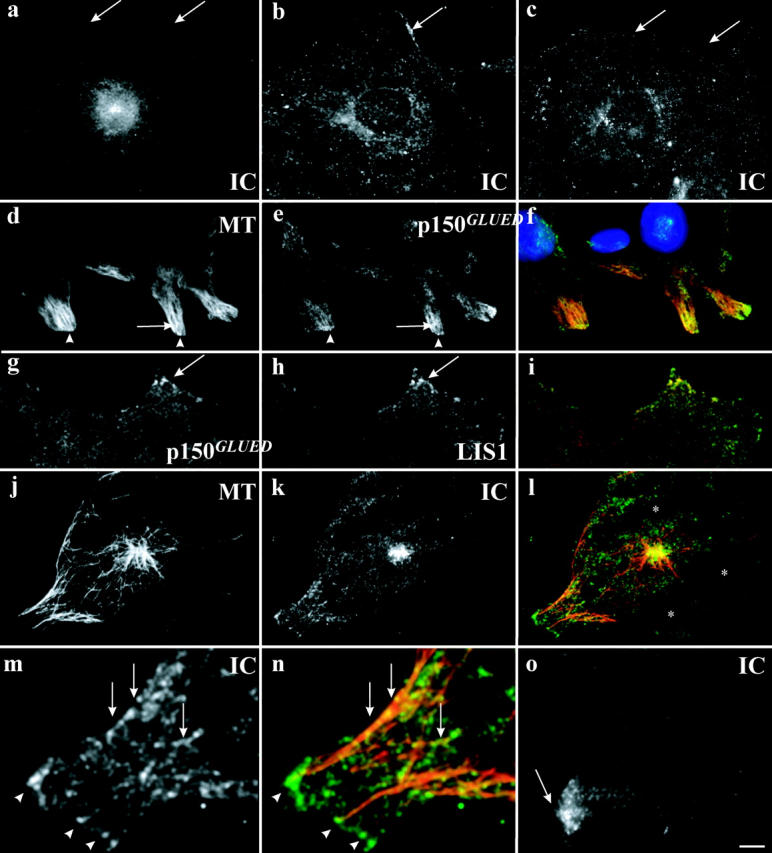
Figure 3.

Epifluorescence and TIRF microscopy during early times of wound healing. (a–c) Immunofluorescence microscopy of dynein in (a) serum-starved cells at wound edge (arrows); (b) 2 h after serum addition; (c) 2 h after LPA addition. (d–i) TIRF microscopy of serum-grown cells 1 h after wound- ing stained with (d) antitubulin; (e) antidynactin (p150GLUED); (f) merge (p150GLUED, green; DAPI staining, blue); (g) antidynactin (p150GLUED); (h) anti-LIS1; and (i) merge (LIS1, green). (j–n) TIRF microscopy of serum-starved cells exposed to LPA for 45 min stained with (j) antitubulin; (k) antidynein; (l) merge (dynein, green); (m) increased magnification of k; (n) increased magnification of l. (o) TIRF microscopy of serum-grown cells exposed to cytochalasin D for 45 min stained with antidynein. Bar: (d–f) 7 μm; (a–c, g–l, and o) 5 μm; (m and n) 2 μm.
