
Figure 4.
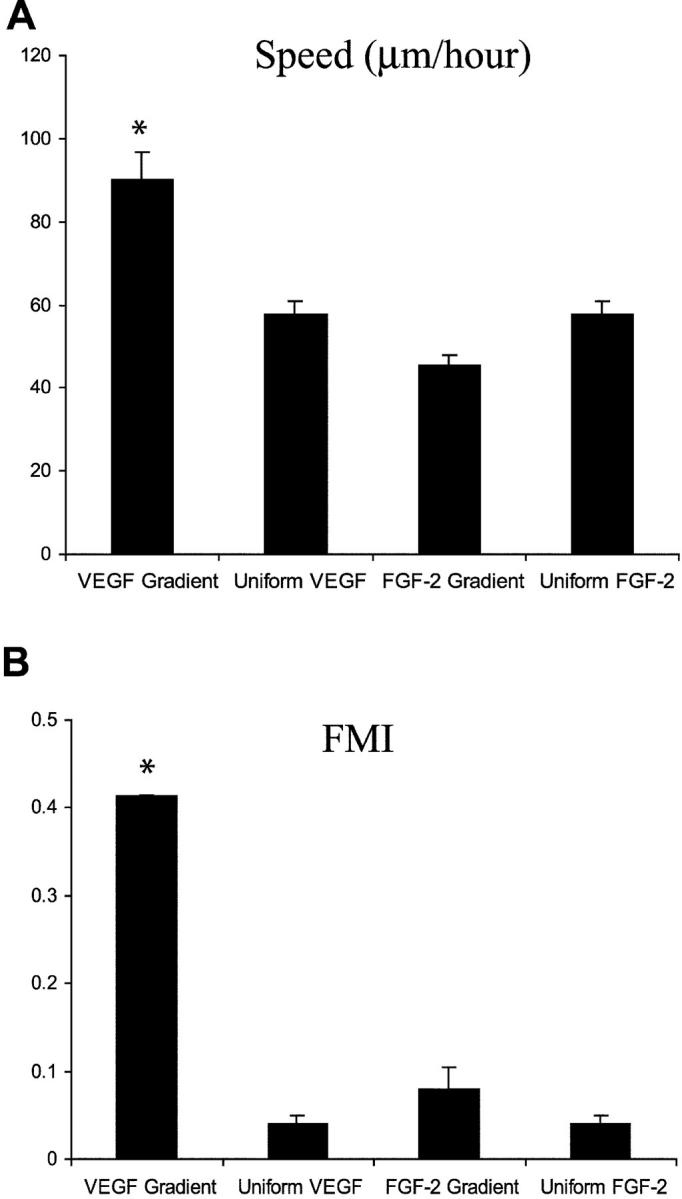
The migration speed (μm/hr) and FMI values under different conditions. (A) Cell migration speed was calculated for each time-lapse interval and the mean speed was derived for a period of 2 h. Data are shown as mean ± SEM from at least three independent experiments. FMI values (B), as described in Materials and methods, can be either positive or negative, depending on the direction in which the cells migrate. *, P < 0.01 by two-tailed unpaired t test, significantly different from chemokinesis or an FGF-2 gradient.