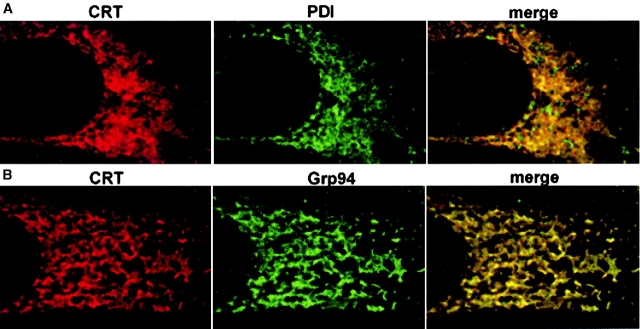
Figure 1.
The distribution of Ca 2+ -binding proteins within the endoplasmic reticulum of mouse embryonic fibroblasts, in relation to calreticulin (CRT), as shown by double immunofluorescence labeling and visualized by confocal microscopy. For methods, see Mesaeli et al. (1999). Left to right: CRT distribution (red), PDI, or Grp94 distribution (green). The last column of each row is an overlay of the two previous images; yellow represents areas of overlap. (A) The distributions of CRT and PDI are overlapping yet distinct. Note the green areas indicative of PDI localization only. (B) The distribution of Grp94 shows virtually complete overlap compared with that of CRT.

