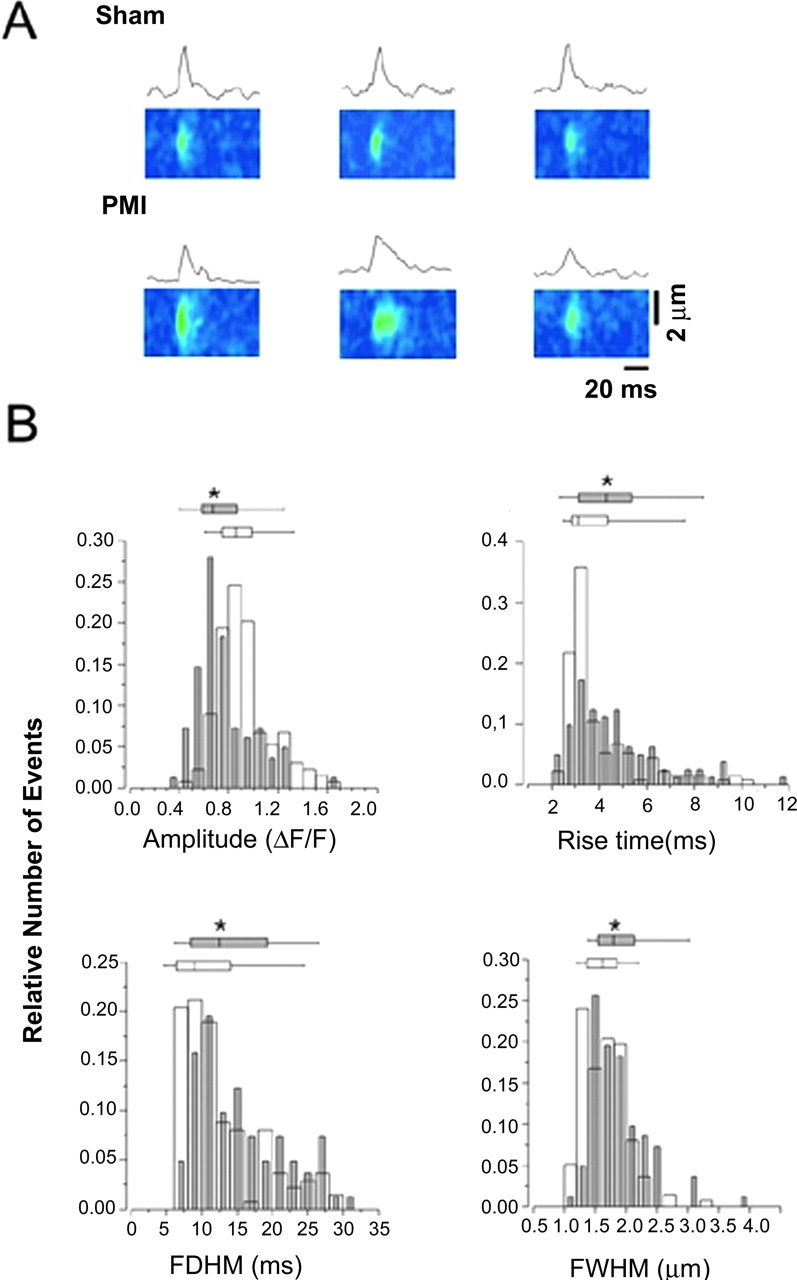
Figure 5.

Defects in local Ca2 + signaling in HF skeletal muscle. (A) ΔF/F line scan images of representative examples of Ca2+ sparks in muscles from sham and postmyocardial infarction (PMI) HF rats and Ca2+ sparks time course. (B) Relative distributions of the spatio-temporal properties of Ca2+ sparks. Charts indicate 25, 50, 75 percentiles, the horizontal lines indicate the range from 1–99% of the distribution. Sham, open symbols (n = 137, three animals); postmyocardial infarction (PMI), gray symbols (n = 82, two animals). *, P < 0.05. FDHM, full duration at 1/2 peak amplitude; FWHM, full width at 1/2 peak amplitude.
