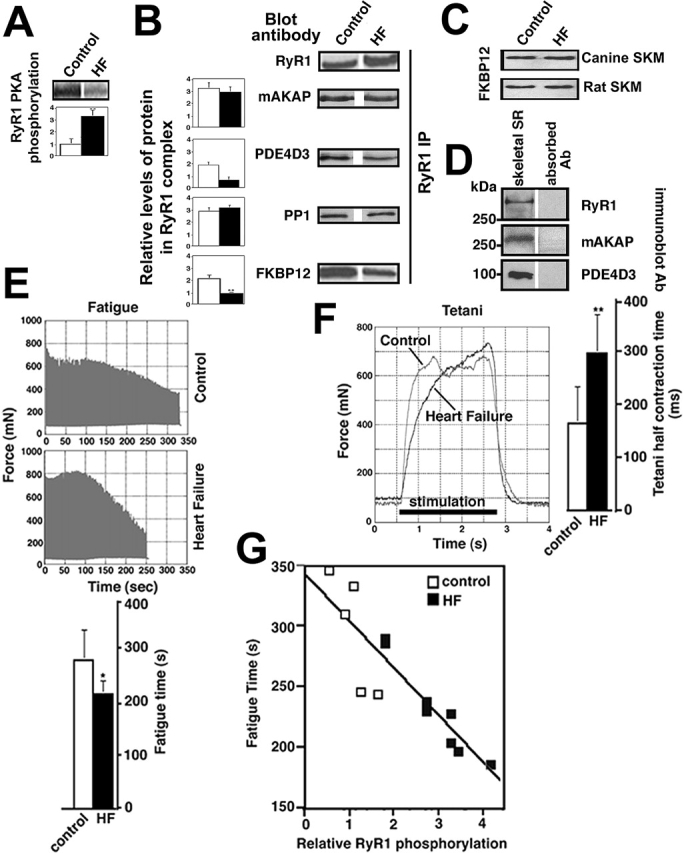
Figure 6.

RyR1 PKA phosphorylation and muscle fatigue. (A) Autoradiogram showing PKA back phosphorylation of RyR1 from skeletal muscle of sham-operated (control) and HF rats, bar graph shows relative PKA phosphorylation of RyR1 (expressed as inverse of back phosphorylation as previously described [Marx et al., 2000]). (B) Immunoblots and bar graphs showing relative amounts of RyR1, mAKAP, PDE4D3, PP1, and FKBP12 immunoprecipitated with anti-RyR1 antibody from control and HF skeletal muscle. (C) Immunoblots showing equal amounts of total cellular FKBP12 in control and HF canine and rat skeletal muscles. (D) Immunoblots showing RyR1, mAKAP, and PDE4D3 detected in 100 μg human skeletal muscle SR; negative controls are with antibodies preabsorbed with the corresponding antigenic peptides. (E) HF skeletal muscle fatigues earlier than control. Rat soleus muscle (n = 5 control, n = 8 HF) was mounted in a tissue bath to assess contractile function (see Materials and methods for muscle function protocols). Representative fatigue time tracing is shown for control and HF skeletal muscles. Bar graph shows mean (±SD) time to fatigue. *, P < 0.05. (F) HF skeletal muscle achieved tetani more slowly than control. Tetani was induced by high-frequency stimulation as described in the Materials and methods. Bar graph shows tetani 1/2 contraction time. **, P < 0.01. (G) Correlation between time to fatigue and RyR1 PKA phosphorylation (r = 0.88) in rat skeletal muscle from sham and HF animals. Muscle function and RyR1 PKA phosphorylation were assessed using contralateral soleus muscles from each animal.
