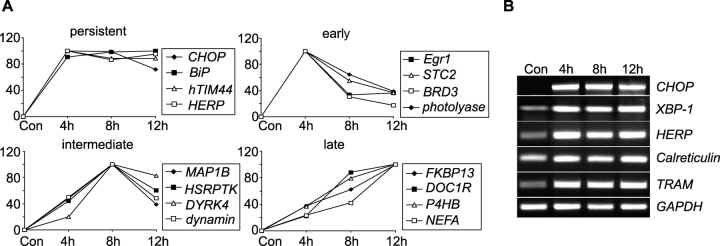
Figure 2.
Selected tunicamycin-induced genes classified with respect to their expression kinetics. Expression profiling by microarray analysis after induction of ER stress was performed as described in the legend of Table I. (A) Four representative genes per group were chosen. (B) Confirmation of gene chip data by semiquantitative RT-PCR analysis of five selected genes. GAPDH served as control. Similar results were obtained in two separate experiments. HERP, homocysteine-inducible, ER stress-inducible, ubiquitin-like domain member 1; STC2, stanniocalcin 2; BRD3, bromodomain containing protein 3; MAP1B, microtubule-associated protein 1B; HSRPTK, homo sapiens receptor protein tyrosine kinase; DYRK4, dual-specificity tyrosine-(Y)-phosphorylation regulated kinase 4; FKBP13, 13-kD FK506-binding protein; DOC1R, deleted in oral cancer-related 1; hTIM44, putative mitochondrial inner membrane protein import receptor; P4HB, proline 4-hydroxylase, beta subunit; NEFA, novel DNA-binding/EF-hand/leucine zipper protein; TRAM, translocating chain-associating membrane protein; XBP-1, X-box–binding protein 1.

