
Figure 9.
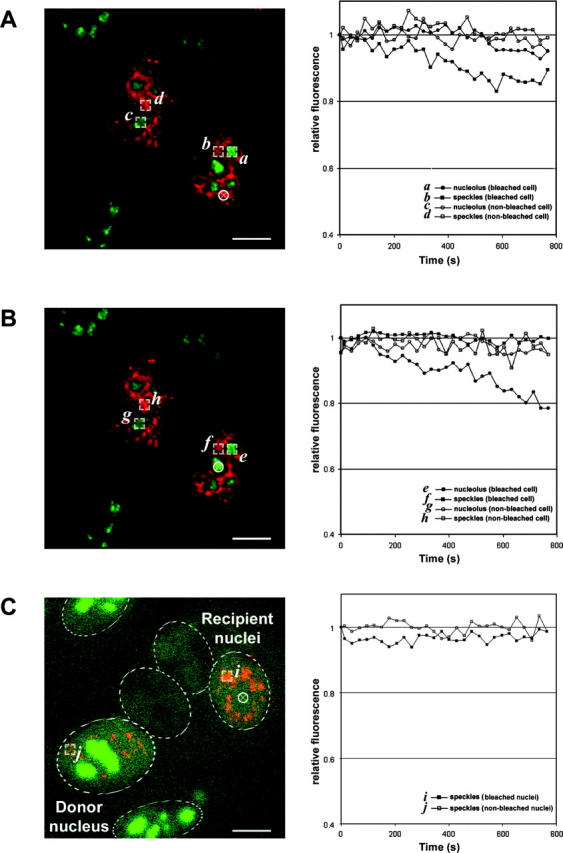
FLIP analysis of HeLaEYFP–NHPX. A region in the (A) speckles and (B) nucleolus was photobleached repetitively every 20 s and the fluorescence intensities of EYFP–NHPX were analyzed over 15 min. The positions of speckles were located in the live cells using DsRED-U1A that were transfected into the cell lines for 24 h before photobleaching and the selected region for photobleaching were highlighted by the white circle in left panel. The fluorescence intensities of EYFP–NHPX in different regions of the bleached and nonbleached cells were compared in right panel. (C) FLIP analysis of the newly imported EYFP–NHPX in speckles of the heterokaryon formed between HeLaEYFP–NHPX and HeLa cells that were both transfected with pDsRED-U1A for 24 h. The position of the nucleolus for photobleaching (left panel, white circle) in the recipient nuclei were located by both phase contrast microscopy and the absence of DsRED-U1A. The fluorescent intensities of EYFP-NHPX in speckles of bleached and nonbleached nuclei of the heterokaryon were analyzed and shown on the right panel. Dotted ovals outline nuclei in the heterokaryon. Bars, 5 μm.