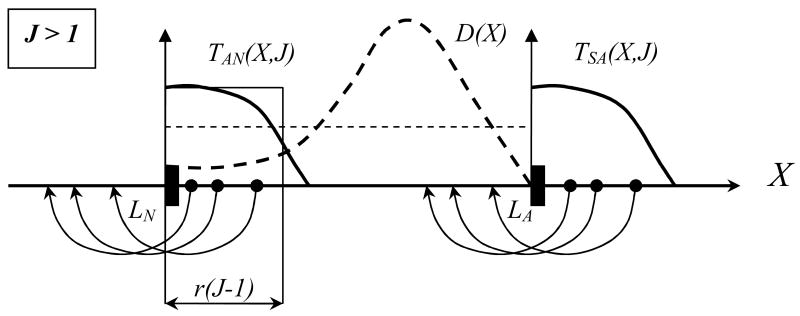
Figure 13.
Schematic view of A → N; S → A transitions (case J > 1: strong clearing immunity) for different X-states in the S and A regions, with a hypothetical distribution D(X) in the A-range. Clearly, states close to interfaces LN;LA have higher transition probabilities. Thin solid and dashed lines show “uniform” approximations of T and D.

