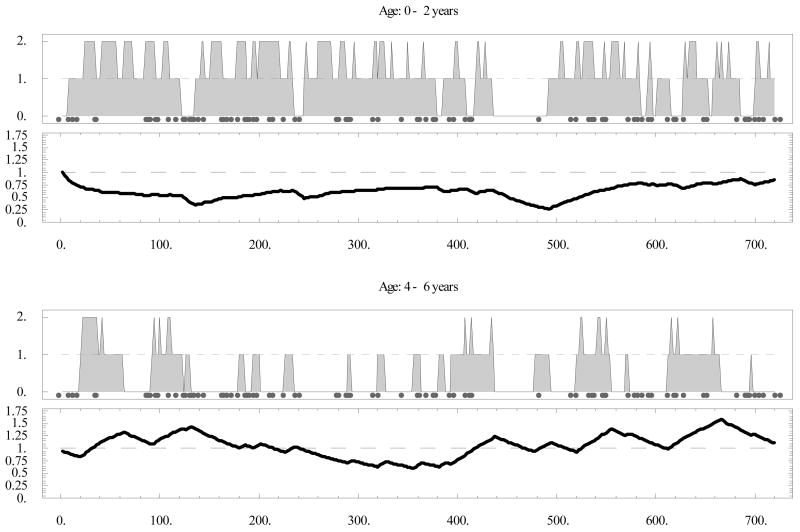
Figure 4.
Individual host history over a 6-year period at entomological inoculation rate (EIR) = 0.1/day (marked with gray circles). Levels {0,1,2} on the upper panels correspond to {N,A,S} states; respectively; lower panels show the immune effector variable J. N = not infected; A = asymptomatic; S = symptomatic.

