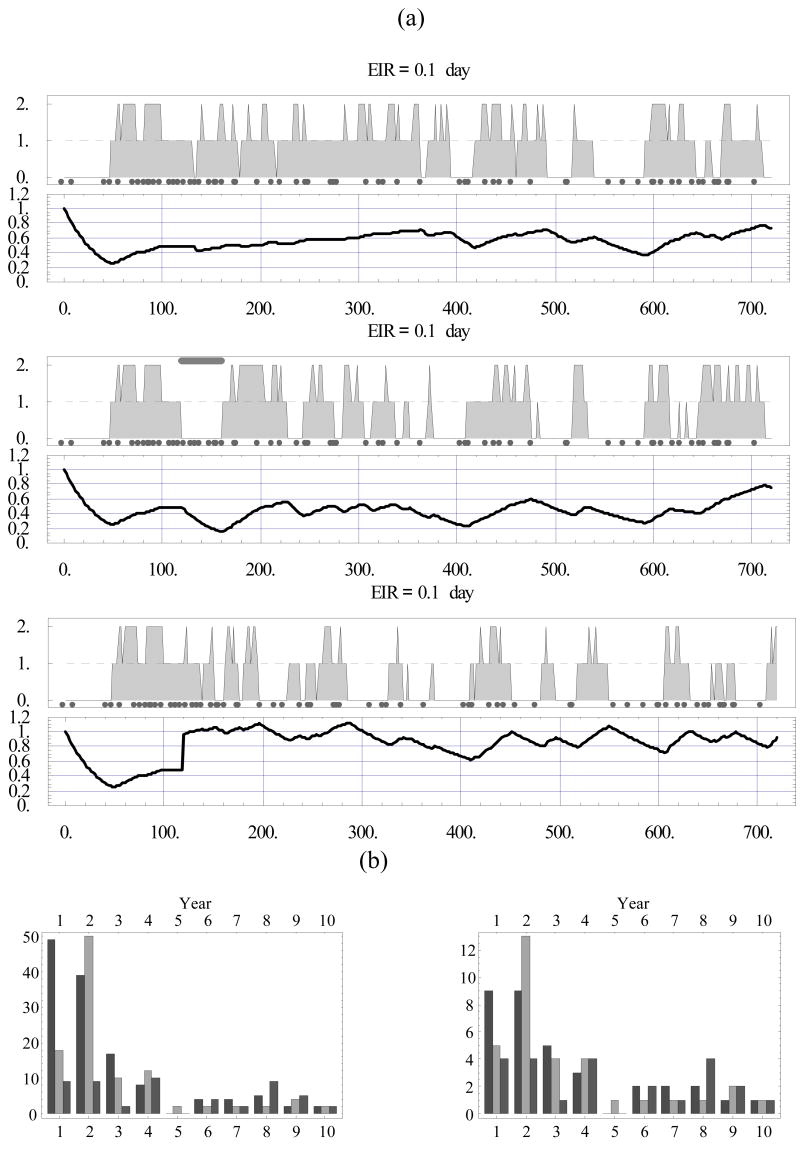
Figure 5.
(a) Identical hosts (with identical inoculation histories) over a 2-year period in three cases: (top) untreated; (middle) drug treatment administered at 4 months with drug half-life of 40 days (marked by gray horizontal bar); and (bottom) vaccination at 4 months. (b) Severity index (left) and severity count (right) in the three cases extended over the 10-year period (left to right bars).

