Figure 6.

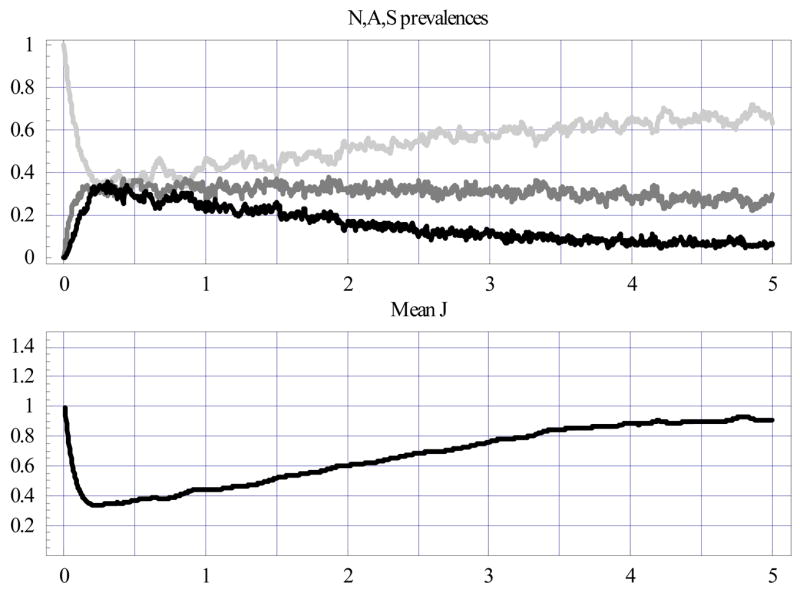
Random ensembles of 500 hosts at entomological inoculation rate (EIR) = 0.05/day. The upper plot shows NAS prevalences (N = light gray; A = medium gray; S = black), the lower one - mean J statistics.

Random ensembles of 500 hosts at entomological inoculation rate (EIR) = 0.05/day. The upper plot shows NAS prevalences (N = light gray; A = medium gray; S = black), the lower one - mean J statistics.