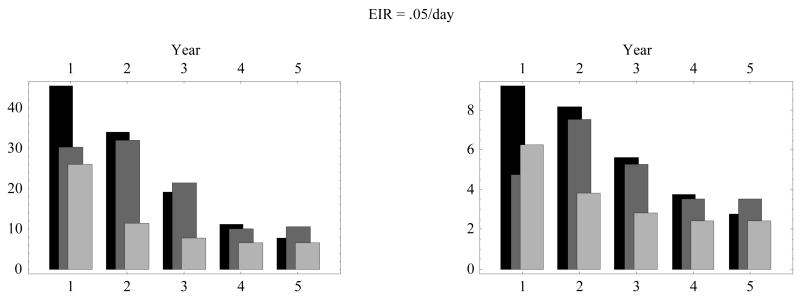
Figure 9.
Comparison of the ensemble-mean severity index (left) and severity count (right) over yearly bins (0–1; 1–2; … 4–5) for three ensembles: (i) the aging cohort of Fig. 6 (black bars); (ii) the treated cohort of Fig. 7 (gray bars); and (iii) the vaccinated cohort of Fig. 8 (light gray bars). EIR = entomological inoculation rate.

