
Figure 2.
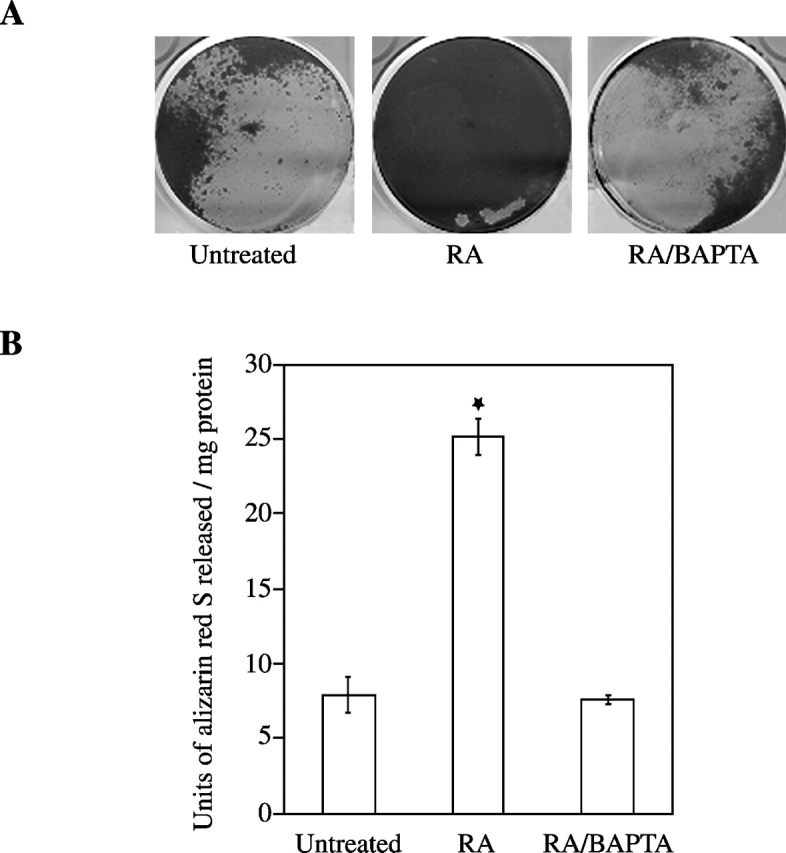
Extent of matrix mineralization in chondrocyte cultures treated with RA or RA/BAPTA. Growth plate chondrocytes were treated with RA or RA and BAPTA for 6 d. (A) Note the intense alizarin red S staining in cultures treated with RA. In contrast, less staining was detected in untreated or RA/BAPTA-treated cultures. (B) To quantitate the alizarin red S stain, each dish was incubated with 100 mM cetylpyridium chloride for 1 h. The alizarin red stain released into solution was collected, diluted when necessary, and read as units of alizarin red released (1 unit is equivalent to 1 unit optical density at 570 nm) per mg of protein. Data were obtained from four different experiments and values are mean ± SD. (★, P ≤ 0.01 vs. untreated cultures.)