
Figure 5.
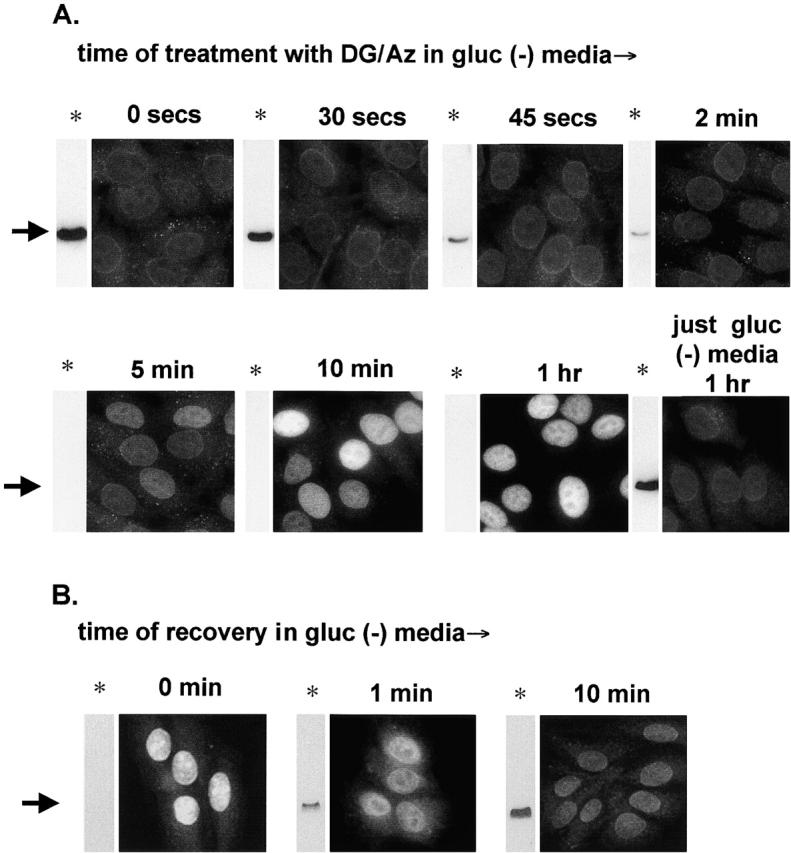
A time course of 2-deoxyglucose/azide treatment and recovery comparing the availability of RanGTP with the nuclear buildup of Kap-α. For each time point in A and B, the cellular localization of Kap-α as determined by indirect immunofluorescence microscopy (performed as in Fig. 2) was compared with the RanGTP from NEM-treated cellular extracts that bound to the RanBD (performed as in Fig. 4 C, lanes 2 and 3, arrow). (A) HeLa cells were incubated for the indicated time at 37°C in gluc− media containing 2-deoxyglucose/azide. (B) After treatment in 2-deoxyglucose/azide for 1 h, the cells were washed once in prewarmed gluc− media, and then transferred to prewarmed gluc− media and incubated at 37°C for the indicated time. To emphasize the heterogeneity in Kap-α nuclear accumulation at longer time points, the same relatively short camera exposure time was used for all of these micrographs.