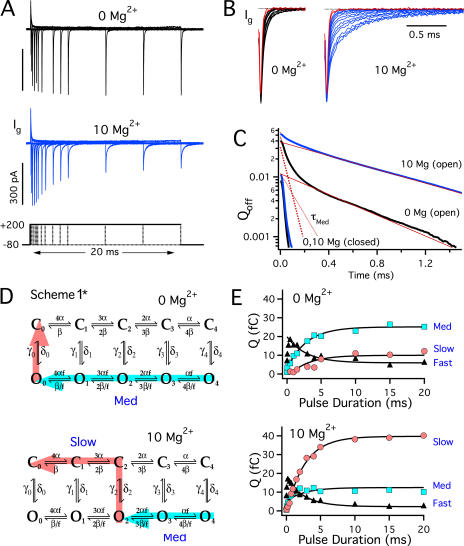
Figure 6.
Mg2+ affects voltage sensor deactivation when channels are open. (A) Ig evoked by pulses to +200 mV of different duration (0.05–20 ms) in 0 and 10 mM Mg2+. (B) Normalized OFF currents from A decay more slowly as pulse duration increases, especially in the presence of Mg2+. Red traces represent 0.05 and 0.1-ms pulses. (C) OFF kinetics at −80 mV following brief (closed) or prolonged (open) pulses are compared by plotting the quantity Q = QOFF(t) − QOFFSS on a log scale vs. time where QOFF is the integral of IgOFF and QOFFSS is the steady-state value of QOFF(t). The “closed” traces, representing the average of 0.05 and 0.1-ms records, have an exponential time course with almost identical kinetics (τFast) in 0 Mg2+ (15.5 μs) or 10 mM Mg2+ (16.3 μs). The “open” traces, representing the average of 10, 15, and 20-ms records, were fit by triple exponential functions (0 Mg2+: qFast = 6.2 fC, τFast = 15.5 μs, qMED = 24.9 fC, τMED= 54.1 μs, qSLOW = 11.2 fC, τSLOW = 500 μs; 10 Mg2+: qFast = 2.6 fC, τFast = 16.3 μs, qMED = 10.6 fC, τMED = 127 μs, qSLOW = 39.1 fC, τSLOW = 756 μs). The Med and Slow components of the fits are shown as dotted and solid lines respectively. (D) Scheme 1* depicts the five closed (Ci) and open (Oi) states defined by Scheme 1, where i represents the number of activated voltage sensors (i = 0–4). δi and γi are forward and reverse rate constants for channel opening while α and β are rates for voltage sensor activation when channels are closed, and f =  . Colored arrows represent different pathways of deactivation and QOFF components for open channels in 0 Mg2+ (top) or 10 mM Mg2+ (bottom) at −80 mV. In 10 mM Mg2+, channels can close from open states other than O0 because Mg2+ allows voltage sensors in open channels to remain activated at −80 mV (QO, Fig. 5 E). The figure illustrates one possible pathway, through the O2 state. After channels close, voltage sensors can completely deactivate in 10 mM Mg2+ (QC, Fig. 3 B). This charge movement is limited by the closing rate and therefore contributes to the Slow component of QOFF. (E) The amplitude of the three OFF components (Fast, ▴; Med, light blue square; Slow, pink circle) for the experiment in A are plotted vs. pulse duration and fit by exponential functions (0 Mg2+, τ = 2.8 ms; 10 Mg2+, τ = 2.6 ms).

