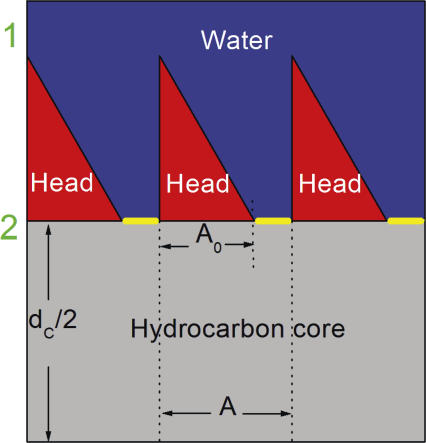
Figure 1.
Schematic drawing showing three lipids in the top monolayer of a bilayer. The horizontal yellow strips indicate the area A − A 0 accessible for passage of solute through the interfacial headgroup layer and into the hydrocarbon core. The shape of the heads provides a rough approximation to the distribution of water in the headgroup region obtained by simulations (Klauda et al., 2006). We note that our definition of headgroup includes not only the phosphatidylcholines, but also the glycerol and carbonyls. As discussed in the text, the interfacial headgroup region might also include the ends of the hydrocarbon chains where chain packing is tightest and the hydrocarbon core would then be smaller than dC obtained from structural studies.

