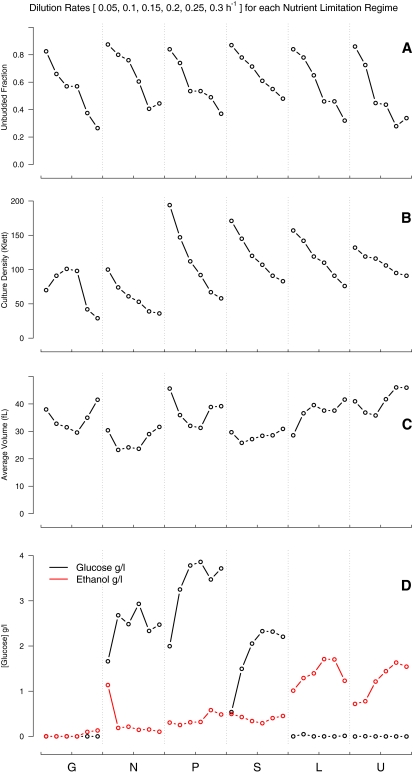
Figure 1.
Measured characteristics of cultures at steady state. Limiting nutrients at bottom of figure. Within each limitation, dilution rates are ordered from 0.05 to 0.3 h−1 in 0.05 h−1 increments. (A) Fraction of unbudded cells. (B) Steady-state culture density in Klett units. (C) Average cell volume. (D) Residual glucose and ethanol levels.

