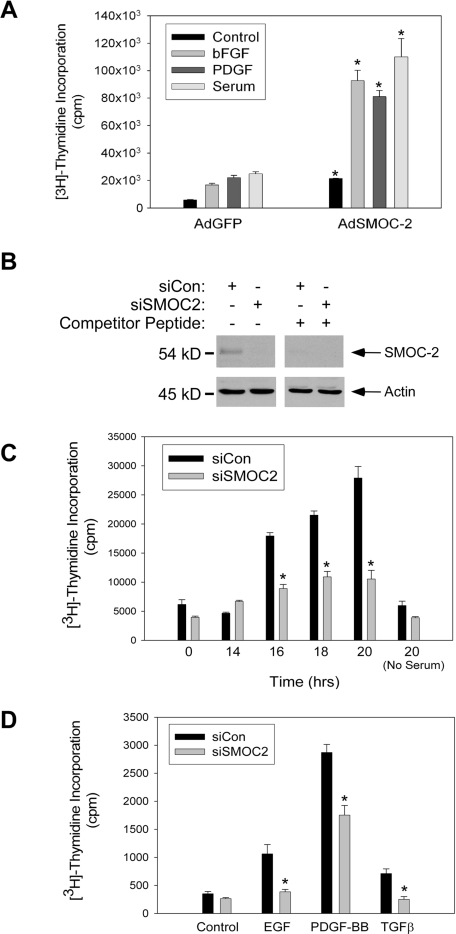
Figure 4.
Role of SMOC-2 in growth factor-induced DNA synthesis. (A) Quiescent Rat1 cells were infected with AdGFP or AdSMOC-2 for 24 h. The resulting cultures were stimulated with serum (10%), bFGF (3 ng/ml), or PDGF-BB (10 ng/ml) for 20 h. Rates of DNA synthesis in the resulting cultures were determined using measurements of [3H]thymidine incorporation. Data points represent the mean for two samples, with error bars representing the range. *p < 0.005 compared with AdGFP-infected cells. (B) Quiescent Swiss 3T3 cells were transfected with siRNA duplexes targeting SMOC-2 (siSMOC-2) or with control Cy3 oligonucleotide duplexes (siCon). Duplicate samples of extracts were from the resulting cells were resolved by SDS-PAGE and transferred to a nitrocellulose membrane. One half of the nitrocellulose membrane was probed sequentially with anti-SMOC-2 and anti-β-actin (left). The other half of the membrane was processed similarly except that primary antibody incubations were performed in the presence of 100 μg/ml SMOC-2 competitor peptide (right). (C) Swiss 3T3 cells were transfected with siSMOC-2 or siCon oligonucleotide duplexes. The resulting cells were made quiescent by serum deprivation. Quiescent siSMOC-2 or Cy3-transfected cells were stimulated to enter the cell cycle by the addition of 10% serum. At different time points after serum stimulation, rates of DNA synthesis were determined using measurements of [3H]thymidine incorporation. Data points represent the mean for two samples, with error bars representing the range. *p < 0.001 compared with siCon-transfected cells. (D) Swiss 3T3 cells were transfected with siSMOC-2 or control Cy3 oligonucleotide duplexes and made quiescent by serum deprivation as described for C. Quiescent cultures were treated with EGF (10 ng/ml), PDGF-BB (5 ng/ml), or TGFβ (5 ng/ml), or they were left untreated for controls. Twenty hours after growth factor treatment, rates of DNA synthesis were determined using measurements of [3H]thymidine incorporation. Note that in the experiment shown here, cells received 10-fold less [3H]thymidine than was used for the DNA synthesis assay in Figure 4C. Data points represent the mean for two samples, with error bars representing the range. *p < 0.001 compared with siCon-transfected cells.

