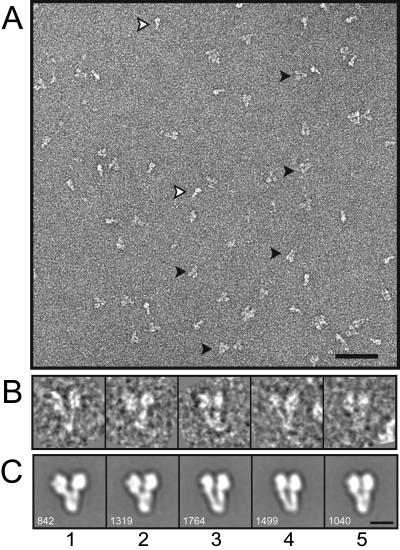
Figure 1.
Negative stain images of γ-TuSC. (A) Section of an untilted micrograph. Y-shaped views (filled arrowheads) predominate, but most images also included i-shaped side views (empty arrowheads). Only Y-shaped views were selected for reconstruction. Bar, 50 nm. (B) Individual untilted particles from the reconstruction data set. (C) Averages of aligned and classified particles, with the indicated number of particles in each class average. Bar, 10 nm (B and C).

