
Figure 5.
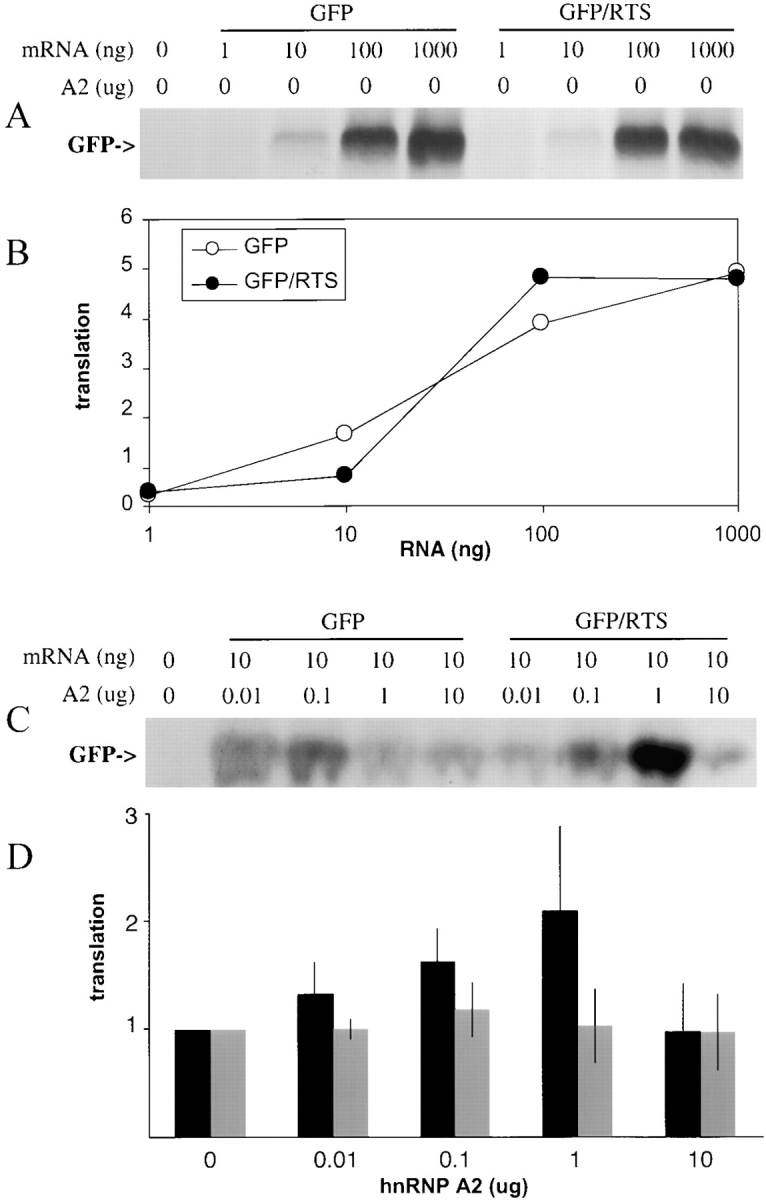
In vitro translation of GFP RNA and GFP/RTS RNA. (A) Increasing amounts of GFP RNA or GFP/RTS RNA were translated in rabbit reticulocyte lysate. Translation products were visualized by SDS PAGE and autoradiography. The band corresponding to GFP is indicated. (B) The intensities of the bands corresponding to GFP in the autoradiogram shown in A were quantitated and plotted in arbitrary translation units versus the amount of GFP RNA (open circles) or GFP/RTS RNA (closed circles) in the translation mixture. (C) Increasing amounts of recombinant hnRNPA2 were added to rabbit reticulocyte lysate along with either GFP RNA (10 ng) or GFP/RTS (10 ng). The translation products were analyzed by SDS-PAGE and autoradiography. The band corresponding to GFP is indicated. (D) The intensities of the bands corresponding to GFP in the autoradiograph shown in C and in three similar experiments were quantitated and are plotted versus the amount of hnRNP A2 added to the lysate. For each RNA the intensity value obtained without hnRNP A2 was set to 1 and the other values normalized accordingly and expressed as translation efficiency. GFP RNA (grey bars); GFP/RTS RNA (black bars).