
Figure 3.
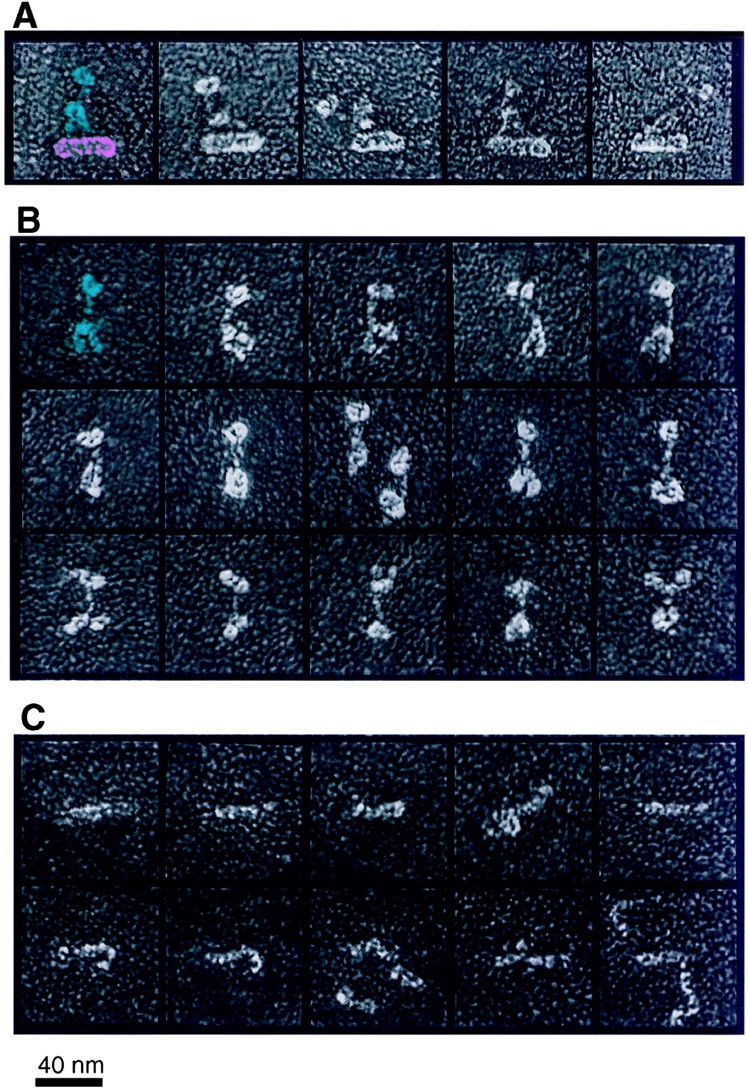
Ultrastructural comparison of intact dynactin (A), sucrose gradient-purified peak A molecules (shoulder/sidearm; B), and sucrose gradient-purified peak B molecules (shoulder; C). In the left-most dynactin image, the shoulder/sidearm structure and Arp1 minifilament domains are pseudocolored blue and pink for emphasis. One peak A molecule (isolated shoulder/sidearm) is colored blue accordingly. Bar, 40 nm.