
Figure 3.
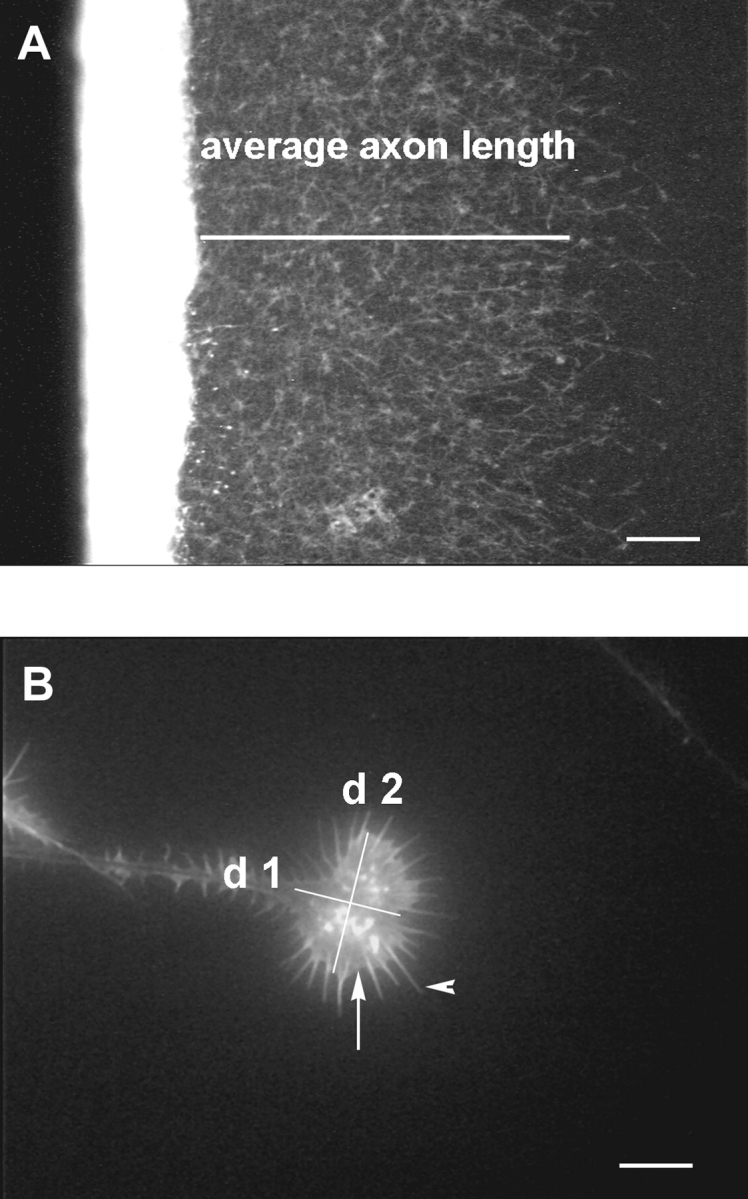
Criteria for data analysis. A shows a control culture on BM after a 24-h incubation time. We defined the average axon outgrowth as the distance between the explant and the growth front covered by at least 60% of the axons. B demonstrates how growth cone data were measured. A growth cone grown on LN was characterized by its two diameters d1 and d2. The arrow indicates lamellipodia and the arrowhead filopodia of the growth cone. Bars: (A) 0.1 mm; (B) 0.01 mm.