Figure 6.
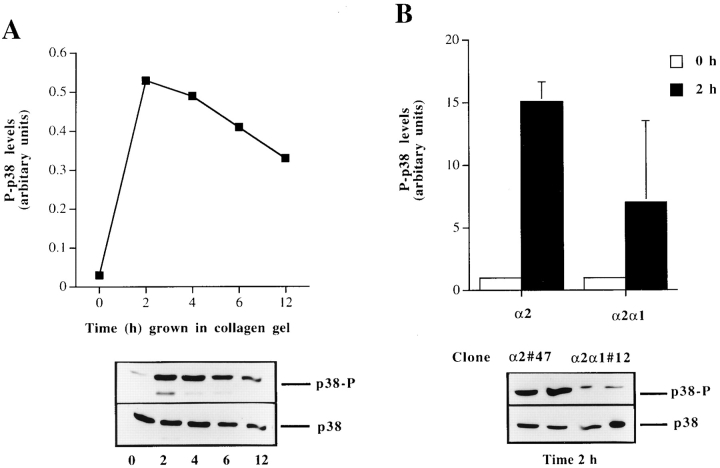
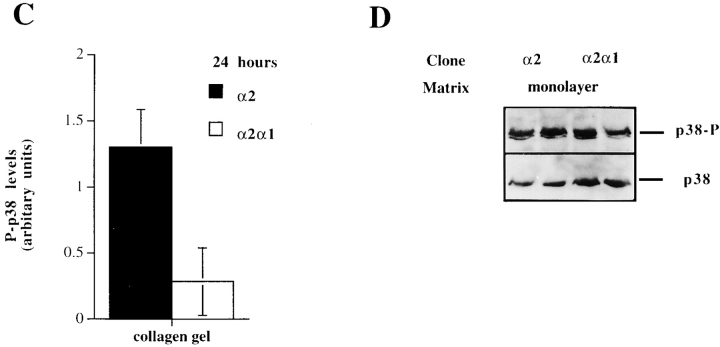
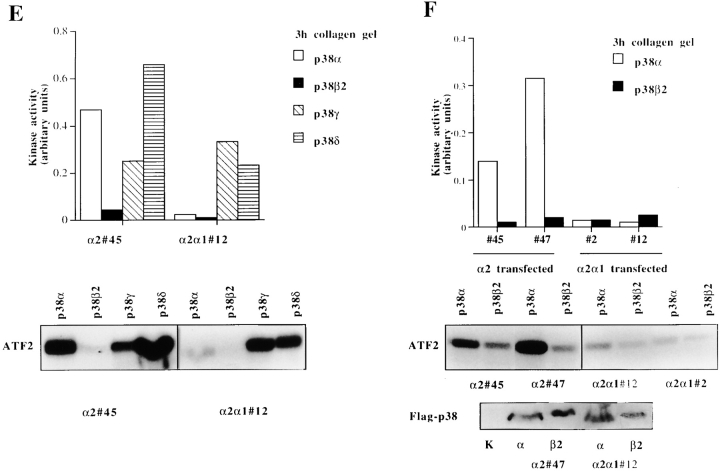
The regulation and isoform-specific activation of p38 by α2β1 integrin in response to matrix. (A) Cells from two separate α2 single cell clones (45 and 47) were pooled together and seeded in collagen gel and incubated for different periods of time, as indicated. The levels of activated p38α and p38β (p38-P) were determined by Western blot analysis using a phosphospecific antibody for p38α and β, antibody recognizing all forms of p38 was used as a control. The levels of activated p38 were quantitated by using an image analyzer system and are shown relative to the levels of total p38 present in each sample. (B) To test the role of the α2 cytoplasmic tail, the experiment was done with 0 h in the 2-h time points using both α2-transfected clones (45 and 47) and α2/α1–transfected clones (12 and 2). The levels of activated p38 were quantitated by using an image analyzer system and are shown relative to the levels of total p38 present in each sample. The data are mean of three separate experiments with different single cell clones ± SD. Autoradiogram of a representative experiment done in duplicate showing p38-P levels at 2-h time point is shown. (C) Levels of active p38 after 24 h culture of cells inside collagen gel. The data shown are mean ± SD of a representative experiment done in quadruplicate. **, P < 0.001. (D) Activation of p38 in α2 and α2/α1–transfected Saos-2 cells grown on a monolayer. Cells from two separate α2 cell clones (45 and 47) or α2/α1 clones (2 and 12) were pooled together and grown in a monolayer for 24 h. (E) Equal numbers of stable transfected Saos-2 cells were transiently transfected with flag-tagged p38 isoforms (α, β2, γ, or δ) and treated and assayed for p38 kinase activity. The levels of phosphorylated ATF-2 were quantitated using an image analyzer system and are shown as levels of ATF-2 phosphorylation with background correction (signal from control transfected cells subtracted). α2 clone 45 and α2/α1 clone 12 were transfected with either the control vector or the p38 isoforms indicated (F) α2 clones (45 and 47) and α2/α1 clones (2 and 12) were transfected with control vector, p38α, or p38β2. Expression of the two flag-tagged isoforms was checked with Western blot analysis using flag-tag recognizing antibody M2.


