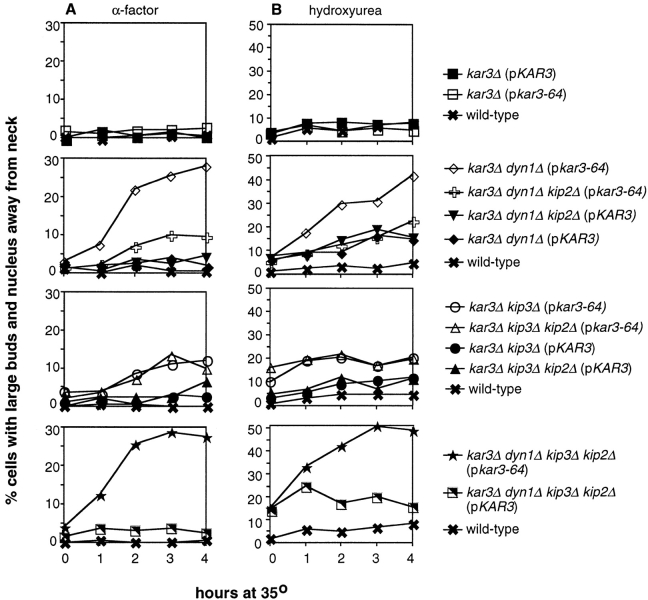
Figure 3.
Quantitation of nuclear positioning defects. (A) Nuclear positioning defects following α-factor synchronization at 26°C and release to 35°C. At the time points indicated, samples were removed, stained with DAPI, and the percentage of total cells that were large-budded with the nucleus positioned away from the bud neck was determined (defined as those in which the closest distance between the nucleus and the neck was greater than one half of the diameter of the entire nuclear DNA mass). (B) Nuclear positioning defects after hydroxyurea synchronization at 26°C and a shift to 35°C in the continued presence of hydroxyurea (also see Fig. 2). At the time points indicated, cells were analyzed for nuclear position as in A. Strains used are listed in legend of Fig. 1.

