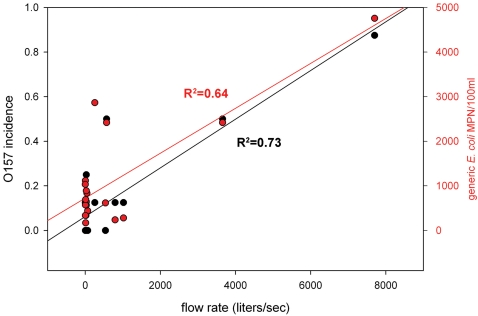
Figure 2. Correlation of water flow, the concentration of generic E. coli, and the incidence of EcO157 in the Gabilan Creek (Salinas, CA).
Linear regression R2 values are indicated. EcO157 incidence is calculated as the fraction of the number of positive samples compared to the total samples obtained. The flow rate was obtained from data from the USGS sampling station #11152600 located at position D (see Figure 1). EcO157 incidence and generic E. coli concentration were determined with duplicate samples.

