
Figure 5. Conformational exchange on the intermediate time scale in the TM2 domain.
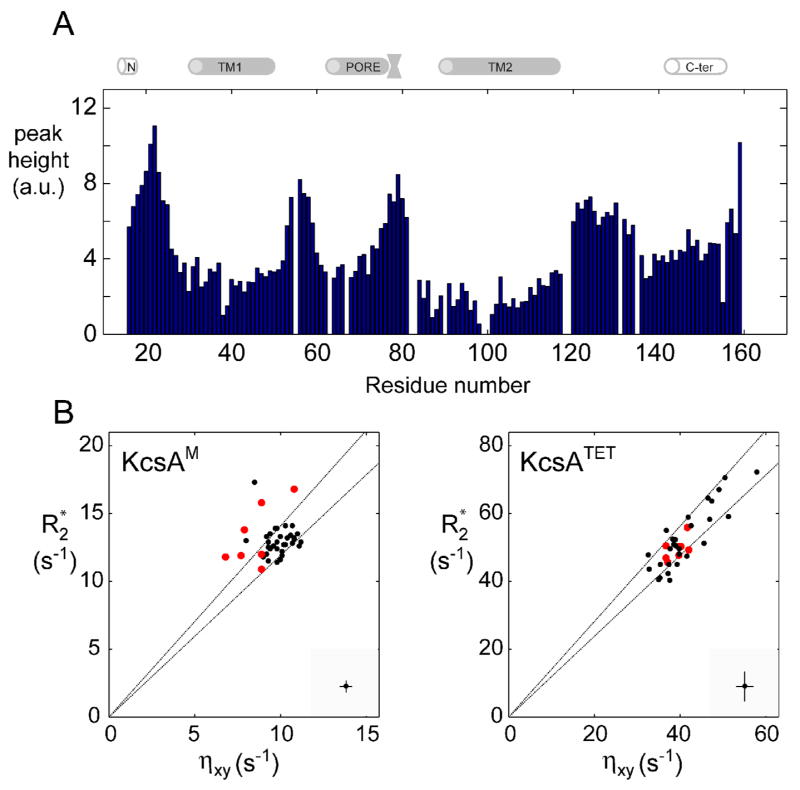
(A) Intensity of tr-HNCO peaks (arbitrary units) along the KcsAM sequence. Spectrum was recorded at 600 MHz and 323 K for a 0.5 mM [2H,13C,15N]-labeled KcsAM in 200 mM SDS and 25 mM formate buffer at pH 4.2. The cartoon above the figure delineates the positions of secondary structure elements as found in the KcsA crystal structure [2] and a previous NMR study [25]. (B) A comparison of 1H, 15N-cross-correlated (ηxy) and transverse (R2*) relaxation rates (as described in Figure 4) for micelle-embedded residues at 600 MHz and 323 K for (left) a 0.5 mM sample of [2H,13C,15N]-labeled KcsAM in 200 mM SDS and 25 mM MES pH 6.0, and (right) a similar sample containing 0.6 mM of KcsATET. In the interest of clarity, typical errors in both parameters are shown at the bottom right corner of each diagram. The two lines indicate the upper and lower limits of the expected scatter of ηxy vs. R2 value assuming an average value of −170 ppm and a spread of ±30 ppm for the 15N chemical shift anisotropy. Values obtained for detectable residues in the TM2 helix segment 98AGITSFGLV107T are shown in red. Elevated R2/ ηxy ratios (points above the upper line) are characteristic of an exchange contribution to transverse relaxation. Note that KcsATETηxy and R2 values exhibit a wider spread due to the rotational diffusion anisotropy of the KcsA-loaded micelle and the inclusion of amide sites from the PORE helix, which is the least collinear with the four-fold symmetry axis.