
Figure 1.
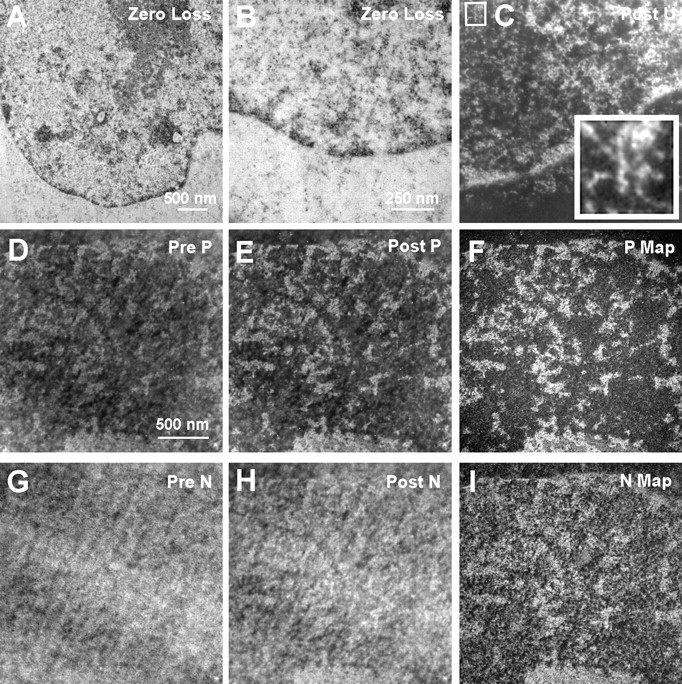
Energy-filtered electron micrographs of a 90-nm section stained with uranyl acetate (A–C). Elastic images, collected at 0-eV energy loss (A and B), show chromatin and other structures as black on a grey background. An energy-loss image recorded at a uranium edge (120 eV; C) shows chromatin and other structures as white on a black background. The inset (4×) shows a 10-nm-diam chromatin fiber with periodicity (vertical fiber at center of inset). Fibers of <50% of this thickness are also prevalent in this section. An unstained section from the same block used in A–C was used to map phosphorus and nitrogen. A phosphorus reference image (120 eV; D), a phosphorus-enhanced image (155eV; E), and a phosphorus map (F) are shown. Nitrogen reference (385 eV), enhanced (415 eV), and map are shown (G–I, respectively).