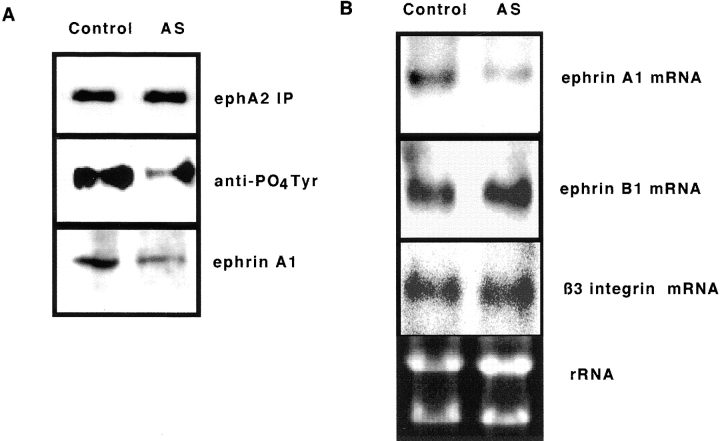
Figure 3.
Expression of ephrin A1 is selectively reduced in EC lacking Hox B3. A, The upper panel shows similar amounts of a 120-kD band corresponding to EphA2 recovered by immunoprecipitation from control transfected (Control) HMEC-1 and HMEC-1 transfected with antisense against Hox B3 (AS). The middle panel shows subsequent blotting with an antiphosphotyrosine antibody and reveals a reduced level of phosphorylation of the EphA2 receptor in cells transfected with antisense against Hox B3. The lower panel shows Western blotting with a polyclonal antibody against ephrin A1 (1:500 dilution) performed on 20 μg total EC lysates from HMEC-1 transfected with control plasmid (Control) or antisense against Hox B3 (AS) and reveals a marked reduction in expression of the ∼28-kD ephrin A1 protein. B, Northern blot analysis using 10 μg total RNA isolated from control transfected HMEC-1 (Control) or HMEC-1 transfected with antisense against Hox B3 (AS). The upper panel shows reduced levels of ephrin A1 mRNA in AS as compared with control cells. The middle and lower panels show the same blot reprobed with cDNAs corresponding to either ephrin B1 or integrin β3, respectively. The bottom panel shows the corresponding rRNA loading controls.

