Figure 5.
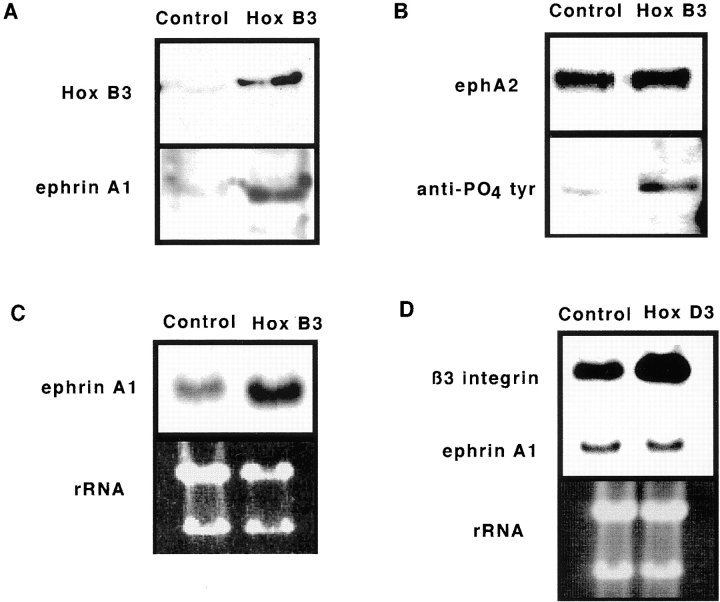
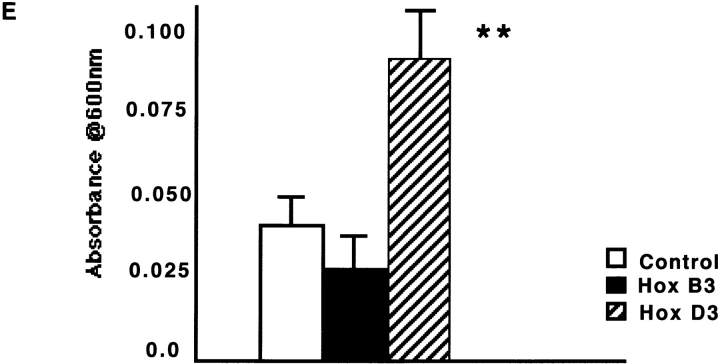
Overexpression of Hox B3, but not Hox D3, enhances expression of ephrin A1 in HMEC-1. A, Comparison of HMEC-1 transfected with empty vector (Control) or CMV-driven Hox B3 expression plasmids (Hox B3). Western blots for expression of Hox B3 (top) and ephrin A1 (bottom) from 40 μg total protein lysates from control transfected HMEC-1 or those overexpressing Hox B3. B, Immunoprecipitation of 300 μg of lysates from control of Hox B3 transfected cells using an ephA2 antibody yields similar levels of the ephA2 receptor (top), whereas subsequent blotting with an antiphosphotyrosine antibody shows an increased degree of phosphorylation of the receptor in cells overexpressing Hox B3 (bottom). C, Northern blot analysis of ephrin A1 mRNA levels (top) from 10 μg total RNA isolated from HMEC-1 transfected with either Hox B3 (Hox B3), or with empty vector (Control). Lower panel shows corresponding ribosomal RNA (rRNA) loading control for each cell type. D, Northern blot analysis for β3 integrin and ephrin A1 mRNA levels in 10 μg total RNA isolated from in HMEC-1 transfected with CMV-driven Hox D3 expression plasmids (Hox D3) or empty vector (Control). Lower panel shows corresponding levels of ribosomal RNA (rRNA) visualized with ethidium bromide. E, The influence of Hox gene expression on EC migration. Migration of HMEC-1 transfected with control plasmid (□), Hox B3 (▪), or Hox D3 .
) was assessed after 5 h in modified Boyden chambers coated with 20 μg/ml fibrinogen. Data are expressed as the mean ± SD (n = 3). **P < 0.05.


