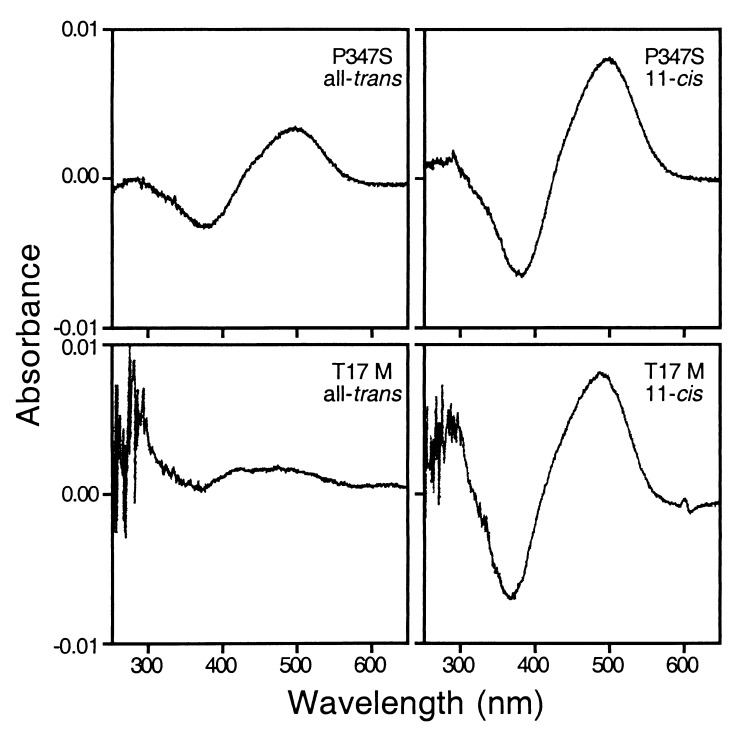
Figure 6.
Photobleaching difference spectra of mutant opsins expressed in 293 cells. Genotypes of each mutant and the retinals present during cell culture are indicated. Cell culture was scaled up 3-fold for the T17M mutant (using three 150-mm dishes) relative to the P347S mutant because the T17M rhodopsin was produced at a lower level.

